


White paper · Transform · 15 min read
Sources: Staples, Arnott's and Fletcher Insulation case studies published on pricinginsight.com, and the Pricing Periodic Table, CXO Edition. All three are realised results as reported by Pricing Insight, not independently audited, and none is a benchmark for another business.
Pricing gains are lost after the analysis, not in it. A margin plan can carry owners, deadlines and action steps and still fail to hold if the work starts all at once, nothing checks that policy is followed, targets are shared, the rhythm is loose, the leakage is not mapped and the sales team has no answer for the customer.
The question this paper answers
Why do B2B pricing projects fail, and what does a CEO put in place so the margin gains last?
Key takeaways
- Pricing gains are more sustainable when initiatives are sequenced by financial impact rather than launched all at once.
- Pricing processes need compliance checks, escalation for repeat breaches and links to performance reviews and incentives.
- Assign one accountable owner to each pricing workstream and target.
- Quantify the sources of margin leakage, establish a regular review rhythm and equip sales teams to explain price changes to customers.
Five client cases follow in the same six-part form: the problem and what it put at risk, why it was hard to fix, what Pricing Insight did, the outcome with its status, the benefit to the client, and the Pricing Periodic Table elements the work built. The first is the distributor plan this paper reviews; the other four are published Pricing Insight clients whose gains were held.
01A margin plan with owners and deadlines still did not hold its gains
Earlier this year, I reviewed a margin improvement plan from a large B2B distributor. Internally, they called it Project Delta.
The overall goal was clear: increase gross margin from 27% to 30%. One main lever was boosting margins on bought-in lines and special orders, from 17% to 30%. Alongside were process updates, price file changes, and competitive resets.
The stakes were high: over $350,000 a month was being lost due to avoidable price support, and nearly $870,000 a year was leaking through outdated pricing and weak file control.
On paper, the plan had structure: owners, deadlines, and action steps.
In practice, the gains did not hold.
The issue was not a lack of intent. It was that the plan missed the fundamentals that make pricing change sustainable.
Project Delta
Large B2B distributor · Over $350,000 a month at risk · Identified
| Client and problem | The distributor set out to lift gross margin from 27 to 30 per cent, with bought-in and special-order margins to rise from 17 to 30 per cent. Its plan identified over $350,000 a month lost to avoidable price support and nearly $870,000 a year leaking through outdated pricing and weak price file control. |
| Challenge | Four workstreams started at once, policy had no check, many targets were shared between several people, timings read "ongoing", no leakage map ranked the causes, and the sales team had no plan for the customer conversations a 13-point rise in special-order margin would start. |
| What Pricing Insight did | Ron Wood reviewed the plan against the fundamentals of sustainable pricing change and set out a fix for each of the seven gaps in section 02, together with five questions for the CEO before sign-off. |
| Outcome | Value at risk of over $350,000 a month and nearly $870,000 a year, as identified in the client's own plan. Identified, not realised. |
| Benefit to the client | A sequence, one owner per lever, a fixed rhythm and a ranked leakage map in place of seven parallel streams, which reduces the risk of the monthly loss running on while the plan reads well. |
| Periodic Table elements built | 12 Mi Margin improvement program; 22 Rs Roles and decision rights; 27 Rc Review cadence; 44 Or Override and discount analysis. |
02Sequence the work by financial impact and check that policy is followed
1. Too many priorities, no clear sequencing
In Project Delta, four major streams started at once:
- Fixing the price support process
- Lifting bought-in and special-order margins from 17% to 30%
- Reviewing every price file monthly
- Resetting the top 100 SKUs to stay competitive
All valid, but when everything is urgent, nothing gets done well.
Fix: Rank by financial impact. Deliver the biggest lever first, measure the result, then roll out the next.
2. Process without enforcement
The plan said, "Branches / ASM / KAMs to implement only valid price support claims." Good policy, but no system to verify if it happened.
Fix: Implement a compliance loop that includes weekly reporting, escalation for repeat breaches, and a direct link to performance reviews and incentives.
Staples shows the sequence at work. Quick wins found in the diagnostic came first, the optimisation of 5,000 items second, and a further 2,000 items after the first result was in.
Staples
Office supplies distributor · A$6.8m EBITDA within 12 months · Realised
| Client and problem | Staples, then Corporate Express, sold 25,000 SKUs to more than 20,000 customers on a 27 per cent gross margin and a 6 per cent EBIT margin. Revenue had grown about 5 per cent while profit fell 3 per cent, and newer sales executives were offering discounts of 5, 10 and 15 per cent, two to three times the EBIT margin. |
| Challenge | Prices were set cost-plus in different ways across divisions and states, costs in the system had been inflated so tenders were lost on price, and experienced sales staff were leaving. |
| What Pricing Insight did | An SKU-level diagnostic on more than 5,000 items, starting with quick wins worth over A$1m of gross margin; fragile tape, for example, sold at about A$2.50 because its system cost was wrong. Project Blackbird price optimisation followed, then staff training in value-based pricing and a dedicated pricing management function. |
| Outcome | A$6.8m EBITDA within 12 months on A$80m of addressable revenue, a realised result as published. A further 2,000 items were then optimised for about A$1m more margin. |
| Benefit to the client | Margin restored where discounting had run at two to three times EBIT margin, and a pricing function that owned the result after the project, so the gain did not depend on the project team staying. |
| Periodic Table elements built | 12 Mi Margin improvement program; 26 Pf Pricing function mandate; 46 Pm Price modelling; 57 Dq Pricing master data. |
03Give every target one owner and the program a fixed rhythm
3. Targets without clear owners
Some goals were specific ("lift margin 1.5% minimum"), others were general ("focus on execution through sales channel"). Many were assigned to multiple people, which dilutes responsibility.
Assign one accountable owner per workstream. Others support, but only one person's name is on the number.
4. No operating rhythm
Items marked "Commence in March and ongoing" or "in effect now and ongoing" are too loose to keep momentum.
Fix: Lock in a cadence:
- Price file reviews first Monday of every month
- GM performance calls every Friday
- Monthly scoreboard shared across branches
Two clients show ownership and rhythm built into the business. Arnott's moved pricing decisions from 41 account managers to a central team; a foodservice packaging supplier gave its pricing team a mandate and a monthly Pricing Council.
Arnott's
Biscuit maker · Over A$5m EBIT recovered within 12 months · Realised
| Client and problem | Pricing and promotional decisions were made account by account across 41 account managers, with overlapping promotional commitments that gave weak returns and channel conflict. |
| Challenge | Promises to customers were made one account at a time and not tracked, so no one person owned the total spend on trade promotions or what it returned. |
| What Pricing Insight did | Reviewed pricing, promotions and trade terms, modelled the return on each promotion and price elasticity across more than 100 promoted SKUs, centralised pricing decisions in a pricing and promotional analytics team, and resolved the channel conflict. |
| Outcome | Over A$5m EBIT recovered within 12 months on a A$100m base, a realised result as published, with less low-return promotional activity. |
| Benefit to the client | One owner for price and promotion decisions in place of 41, and trade spend tied to a modelled return, which lowers the risk of margin being promised away account by account. |
| Periodic Table elements built | 26 Pf Pricing function mandate; 22 Rs Roles and decision rights; 46 Pm Price modelling; 21 Ca Cross-functional alignment. |
Foodservice packaging supplier
Australia and New Zealand, backed by Five V Capital · A$2m EBIT from quick wins · Realised
| Client and problem | The supplier sells through distributors, chains, retailers and thousands of independent venues, so its margin depends on the prices, discounts and rebates it sets. Individually reasonable decisions had combined into a price structure nobody had designed, after three years of rising producer costs with no agreed way to pass them on. |
| Challenge | Rebates were recorded at buying-group level, not per sale, so net margin by account was unknown, and authority to set price was not clearly delegated. |
| What Pricing Insight did | A diagnostic that allocated rebates to customers and products, then a national price list architecture and a discount matrix of a few hundred rules in place of tens of thousands of individually negotiated prices, migrated in four waves. A pricing team with a mandate, a Pricing Council reviewing results monthly, a deal desk answering exceptions within 48 hours, and Pricing University training. |
| Outcome | A$2m of EBIT realised from pricing quick wins, with a further A$6m to 9m of margin identified, as published. |
| Benefit to the client | An owner, a rhythm and written rules in place before the larger identified margin is released, which reduces the risk of it being given back after go-live. |
| Periodic Table elements built | 26 Pf Pricing function mandate; 23 Pn Pricing council; 40 Dd Deal desk and negotiation governance; 51 Dt Discount structure and tiers; 27 Rc Review cadence. |
04Map the causes of leakage first, and prepare the sales team for the customer
5. Fixing symptoms, not causes
"Root cause analysis" was mentioned, but the plan did not show a prioritised leakage map. Effort risks being spread thin.
Fix: Quantify leakage first, for example:
- 40% from unapproved buy-in claims
- 35% from outdated contracts
- 15% from overrides on top SKUs
Address the top three before anything else.
6. Assuming buy-in happens automatically
Raising special-order margins from 17% to 30% led to more price conversations with customers, yet there was no plan in place to equip sales teams to defend the change.
Fix: Provide sales with talking points, value justification, and handling for common objections.
7. Forgetting the customer conversation
The plan was internally focused (contracts, files, costs), but price changes that hit customers need a narrative.
Fix: Train the sales channel to lead with value. A price increase with no story is a short-lived gain.
Fletcher Insulation located its causes before changing anything, then trained the people who quote before the new structure and the price increase went to customers.
Fletcher Insulation
Insulation manufacturing · 250 basis points of gross margin · Realised
| Client and problem | Most customers were individually priced and many quotes were built job by job in spreadsheets, in a product customers compared on square-metre rates against imported alternatives. |
| Challenge | There was no base list price and no published pricing strategy, most pricing decisions sat with one central analyst, and approvals could pass through three or four people. Staff understood the opportunity but lacked the structure, resources and tools to capture it. |
| What Pricing Insight did | A pricing diagnostic across the parent group's six business units located the insulation business's specific gaps before any training began. Staff then completed Pricing University's Pricing Fundamentals, and the business built a new pricing structure, implemented a price increase and reduced discounting. |
| Outcome | 250 basis points of incremental gross margin, an annualised run-rate of about A$2.25m to EBITDA, a realised result as recorded from the engagement. The diagnostic had sized A$2.2m to A$2.5m of EBIT, identified. |
| Benefit to the client | A gain that flowed to EBITDA and a sales team trained in the method before the change reached customers, so the increase and the tighter discounting were held rather than reversed. |
| Periodic Table elements built | 28 Cc Commercial capability and training; 49 Lp List price alignment; 61 Da Discount authority and controls; 43 Pi Price increase process. |
05The CEO's role is understanding, alignment and accountability
The CEO's job is not to edit price files. It is to ensure:
- Understanding: everyone knows the "why" and the upside.
- Alignment: priorities are sequenced, resources focused.
- Accountability: one owner per lever, not a committee.
Before signing off your next pricing plan, ask:
- Do we know exactly where the margin is leaking?
- Have we sequenced fixes by impact?
- Is there one accountable owner per target?
- Do we have a rhythm to track and adjust?
- Can our sales team defend the change to customers?
If you cannot answer "yes" to all five, the gains will be hard to bank, no matter how well the plan reads.
06Four clients show the gains held where ownership, sequence and training were in place
| Gap in Project Delta | Fix | Element | Client that built it |
|---|---|---|---|
| 1. No sequencing | Biggest lever first, measure, then the next | 12 Mi | Staples: quick wins, then 5,000 items, then 2,000 more |
| 2. No enforcement | Weekly reporting, escalation, link to reviews and pay | 61 Da | Foodservice packaging supplier: deal desk and discount matrix |
| 3. Shared targets | One owner per workstream | 22 Rs | Arnott's: pricing decisions moved from 41 account managers to one team |
| 4. No rhythm | Fixed monthly and weekly reviews | 27 Rc | Foodservice packaging supplier: Pricing Council monthly |
| 5. Symptoms, not causes | Quantified leakage map | 44 Or | Fletcher Insulation: diagnostic located the gaps first |
| 6 and 7. No buy-in, no customer story | Talking points, value case, training | 29 Vs | Fletcher Insulation: Pricing University before the increase |
Exhibit 1. The seven gaps in Project Delta, the fix for each and a Pricing Insight client that built it. Sources: published case studies on pricinginsight.com and the Pricing Periodic Table, CXO Edition.
Three things are safe to read from the cases. Speed: Staples and Arnott's each banked their result within 12 months, and both put a central pricing owner in place as part of the work rather than after it. Size: the realised results run from A$2m of EBIT from quick wins at the foodservice packaging supplier to over A$5m at Arnott's and A$6.8m of EBITDA at Staples. Risk: in each case the work removed a route by which a found gain is lost after go-live, whether discounts set by whoever was asked, promotions promised account by account, rebates no one could see or a sales team with no answer for the customer. None of these figures is a benchmark for another business.
07The Pricing Periodic Table elements this paper builds
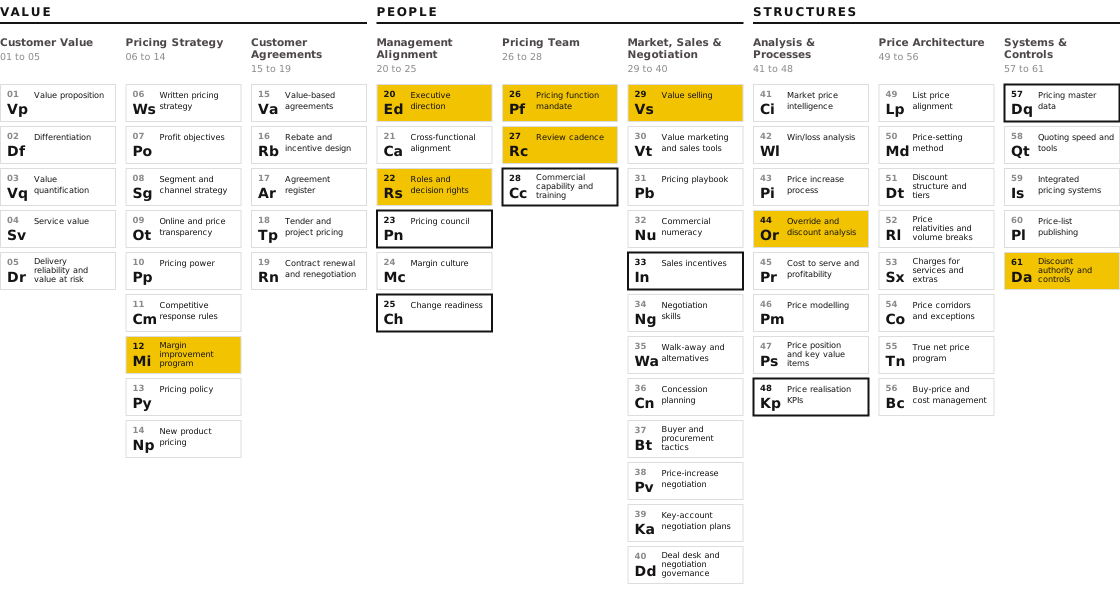
The Pricing Periodic Table sets out 61 elements of pricing capability in nine domains, across Value, People and Structures. Eight are built by the fixes in this paper, shown in gold in Figure 1: 12 Mi Margin improvement program (sequencing by impact), 61 Da Discount authority and controls (the compliance loop), 22 Rs Roles and decision rights (one owner per target), 27 Rc Review cadence (the operating rhythm), 44 Or Override and discount analysis (the leakage map), 29 Vs Value selling (talking points and the customer narrative), 20 Ed Executive direction (the CEO's role) and 26 Pf Pricing function mandate (a team that owns the result after the project). Six are depended on and shown in outline: 33 In Sales incentives, which the compliance loop links to, 23 Pn Pricing council, 48 Kp Price realisation KPIs for the scoreboard, 28 Cc Commercial capability and training, 57 Dq Pricing master data for the price file reviews, and 25 Ch Change readiness.
The client cases map onto these elements directly. Project Delta had 12 Mi on paper without 22 Rs or 27 Rc. Staples built 12 Mi and 26 Pf, Arnott's built 26 Pf and 22 Rs, the foodservice packaging supplier built 23 Pn, 27 Rc and a deal desk under 61 Da, and Fletcher Insulation used 28 Cc so the sales team could carry 29 Vs to the customer.
08Frequently asked questions
Why do B2B pricing projects fail and how do I make the gains last?
Most fail after the analysis. Work starts on every stream at once, policy is not checked, targets are shared, the rhythm is loose, the causes of leakage are not ranked and the sales team cannot explain the change to customers. The gains last when each lever has one owner, the biggest is delivered first, a fixed rhythm reviews the results and sellers are trained before customers hear the change. Staples realised A$6.8m of EBITDA within 12 months with a dedicated pricing function in place.
Who should own pricing after the project team leaves?
One named person per target, and a pricing team with a mandate to own the result. At Arnott's, pricing decisions moved from 41 account managers to a central team, and over A$5m of EBIT was recovered within 12 months, a realised result.
How many pricing changes should we make at once?
Fewer than you plan. Rank the levers by financial impact, deliver the biggest first, measure the result, then roll out the next. Staples took diagnostic quick wins first, optimised 5,000 items second and a further 2,000 after the first result.
What operating rhythm keeps a pricing program on track?
Fixed dates, not "ongoing": price file reviews on the first Monday of each month, gross margin calls every Friday and a monthly scoreboard shared across branches. A Pricing Council that meets monthly and a deal desk with a set response time keep exceptions from becoming the rule.
What should a CEO ask before signing off a pricing plan?
Five questions. Do we know exactly where the margin is leaking? Have we sequenced fixes by impact? Is there one accountable owner per target? Do we have a rhythm to track and adjust? Can our sales team defend the change to customers? If any answer is no, the gains will be hard to bank.
09How Pricing Insight helps
To turn these principles into durable practice, Pricing Capability & Governance helps define pricing roles, decision rights, discount approvals, price floors and a Pricing Council. This gives leaders a framework for clear ownership and consistent enforcement, supporting the review rhythm and accountability needed to protect margin gains.
The work runs in three stages, each drawing on evidence from the client's own transactions. Pricing Insight has completed 160+ engagements, and price optimisation programs return between 5 and 10 times their cost in year 1.
Diagnose
Leakage quantified by source and ranked by value, an opportunity register traceable to transactions, and a baseline the CFO signs before anything moves, through the Strategic EBIT Opportunity & Risk Diagnostic.
Optimise
Levers sequenced by financial impact, each with one owner. Price recommendations and capped movement plans through the EBITDA Improvement Program, released in waves with a review before each.
Transform
Roles, approvals, the Pricing Council and the review rhythm through Pricing Capability & Governance, and sellers prepared to explain the change to customers through Negotiation Training & Value-Based Selling.
Who in your business owns the margin after the project team leaves?
A first conversation establishes how this applies in your business and whether a diagnostic is warranted. Ron Wood, +61 410 534 099.
Ron Wood is the Founder and Managing Director of Pricing Insight, an Australian pricing strategy consultancy he established in 2007. He has worked in pricing for 30 years, first as a pricing and commercial manager in consumer goods, building materials and capital equipment, and since then across 160+ engagements in Australia, New Zealand, South East Asia, India, the United States and the United Kingdom. He also founded Pricing University and is the author of the Pricing Periodic Table, CXO Edition.
To discuss how to make the gains from your pricing program last, contact Ron Wood at info@pricinginsight.com.au or on +61 410 534 099, or visit Pricing Insight.
Project Delta is a distributor described without identification; its figures are identified in the client's own plan and are not results. Staples, Arnott's and Fletcher Insulation figures are realised results as published in Pricing Insight case studies, and the Fletcher Insulation diagnostic figure is an identified opportunity. The foodservice packaging supplier's A$2m EBIT is realised and its further A$6m to 9m is identified, as published. The leakage split in section 04 is an example. Results are as reported by Pricing Insight and have not been independently audited. No figure in this paper is typical or guaranteed.