
.webp)
A pricing expert starts at the invoice and works backwards. Pricing Insight, a Sydney-based pricing consultancy, traces each margin problem to the point where it shows in realised price. It then diagnoses the cause across value, people and structure, sizes the opportunity with Finance, and fixes it with a defined method the client’s own team can run.
This paper sets out that thought process step by step. It draws on four bodies of evidence: capability diagnostics completed with business-to-business companies in Australia and New Zealand, 4,721 written comments from 810 of their employees, 26,253 margin ideas written by Pricing University learners, and completed client engagements. Clients are identified by industry only.
How does a pricing expert look at a pricing problem?
Most pricing problems arrive described as something else. Gross margin is drifting. A price increase fell short. A large customer is asking for another rebate. The sales team says the market has become a commodity. Each is a symptom, and the same symptom can have three or four different causes.
A pricing expert works through five questions before recommending anything:
- What is the margin at stake? Expressed in dollars and basis points, with a conservative and an optimistic range.
- What is the customer’s willingness to pay, and how do we know? Evidence from customers and transactions carries more weight than internal opinion.
- Where is value leaking, and why? The location comes from the price waterfall. The cause comes from the capability diagnostic.
- What would a chief financial officer need to see to approve the change? A baseline signed by Finance, and benefit labelled as annualised or realised in period.
- What does the sales team need in order to change its behaviour? Rules, tools, authority limits and training.
Figure 1 shows how those questions become a working sequence. The order matters. Sizing comes before design so that effort goes to the largest leaks. Embedding comes before measurement because a fix that depends on one analyst fades within a year.
Figure 1. How a pricing expert works a pricing problem
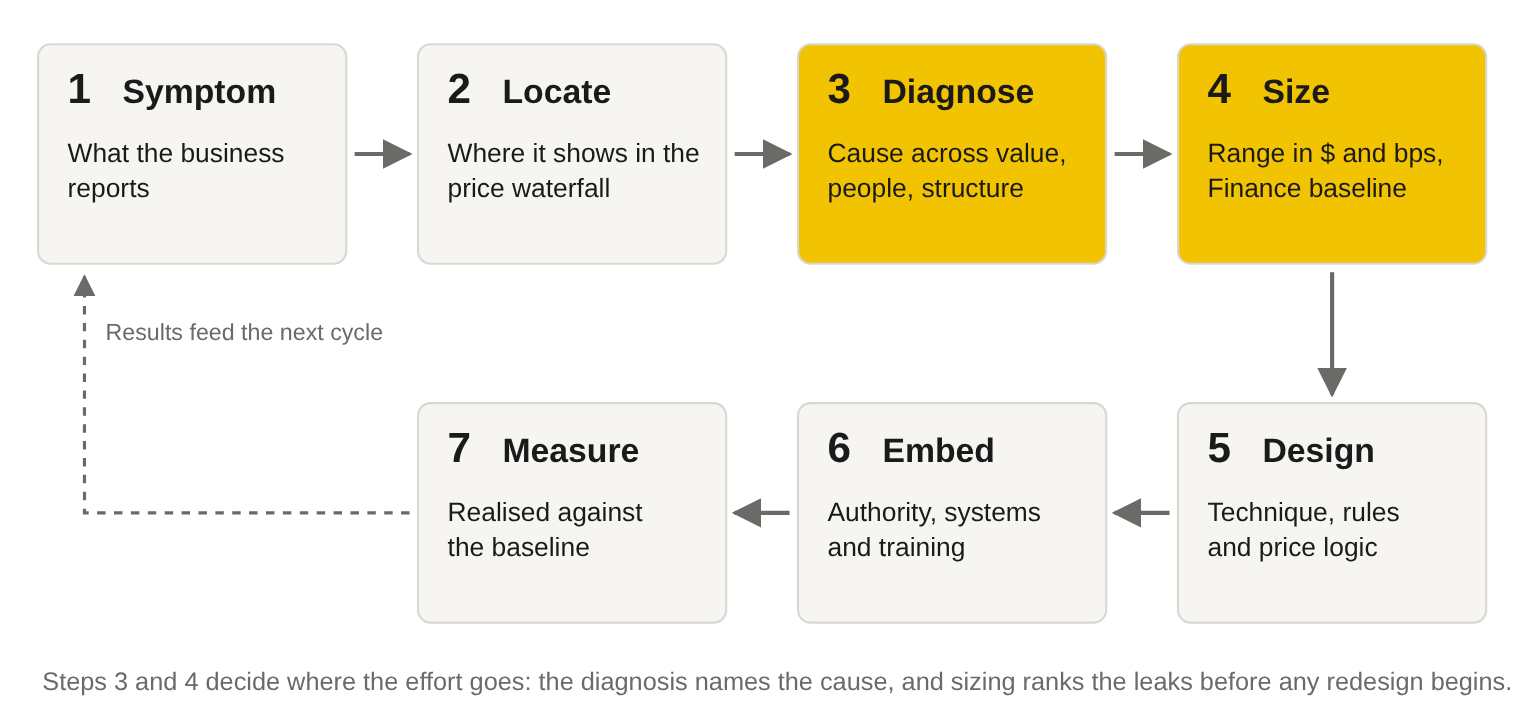
Pricing Insight method.
Where does the margin go between list price and the invoice?
The price waterfall is the first tool a pricing expert reaches for. It starts at list price and deducts every concession in turn: the customer’s standing discount, tactical discounts given to close a deal, rebates, and freight or service costs absorbed without a charge. What remains is the pocket price, which is the money the business actually keeps.
Pricing University teaches five margin levers that map directly to the waterfall: list price, customer discount, tactical discounts, rebates and surcharges. Each lever has its own owner, its own approval path and its own way of leaking.
Figure 2. The price waterfall: where margin goes between list price and pocket price
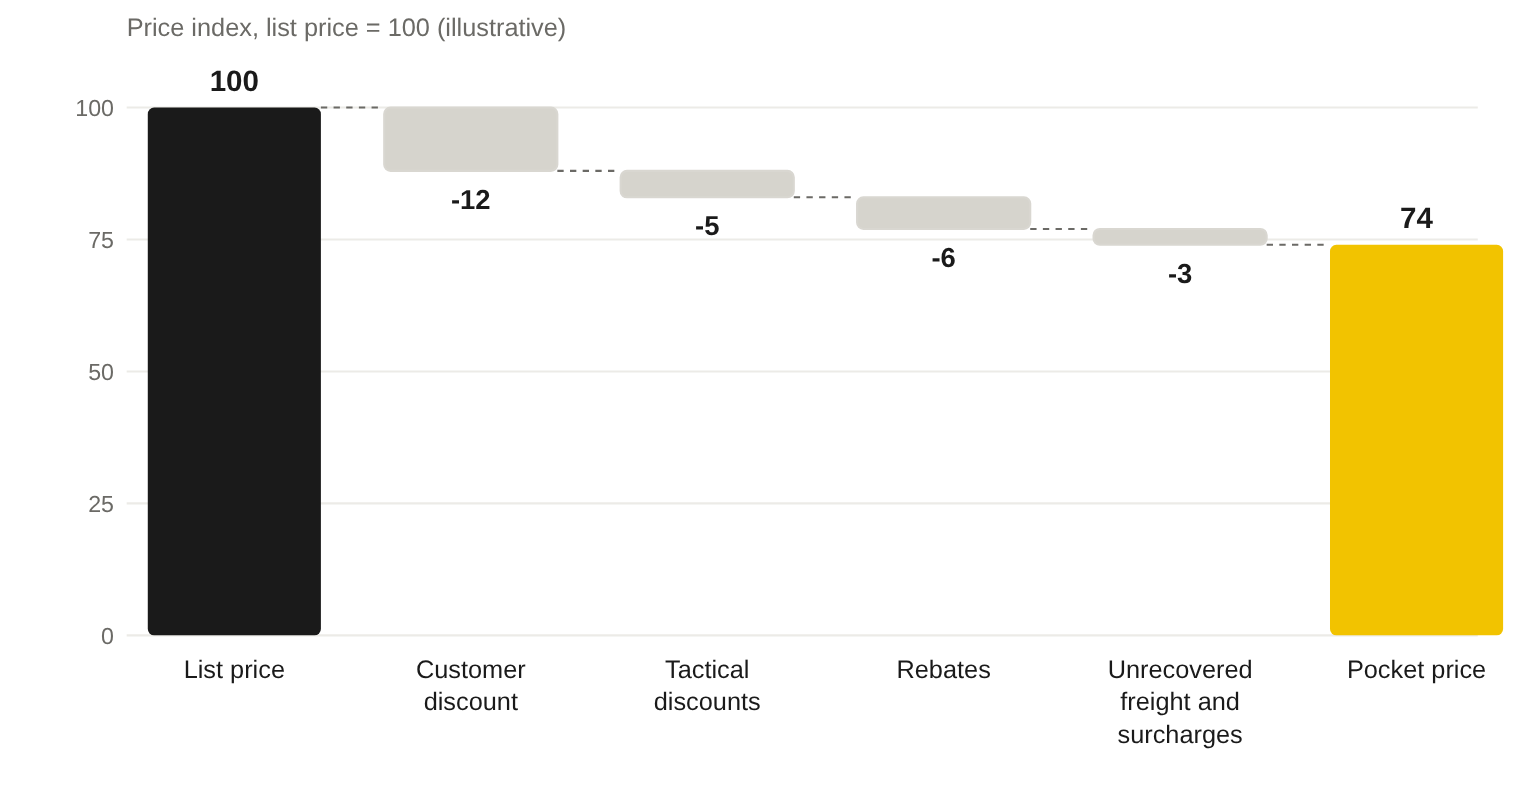
Illustrative values. Levers follow the Pricing University margin expansion framework.
The waterfall gives the location of a leak. It also changes the conversation inside the business. Sales teams usually see the invoice price. Finance sees the gross margin line. Few people see the full set of concessions laid out against one customer at once.
What sits behind the leak? Value, people and structure
The waterfall shows where margin goes. The cause sits in how the business is organised to set and hold price. Pricing Insight uses the 9PE diagnostic canvas to find it. The canvas groups pricing capability into nine domains under three headings.
Figure 3. The 9PE diagnostic canvas
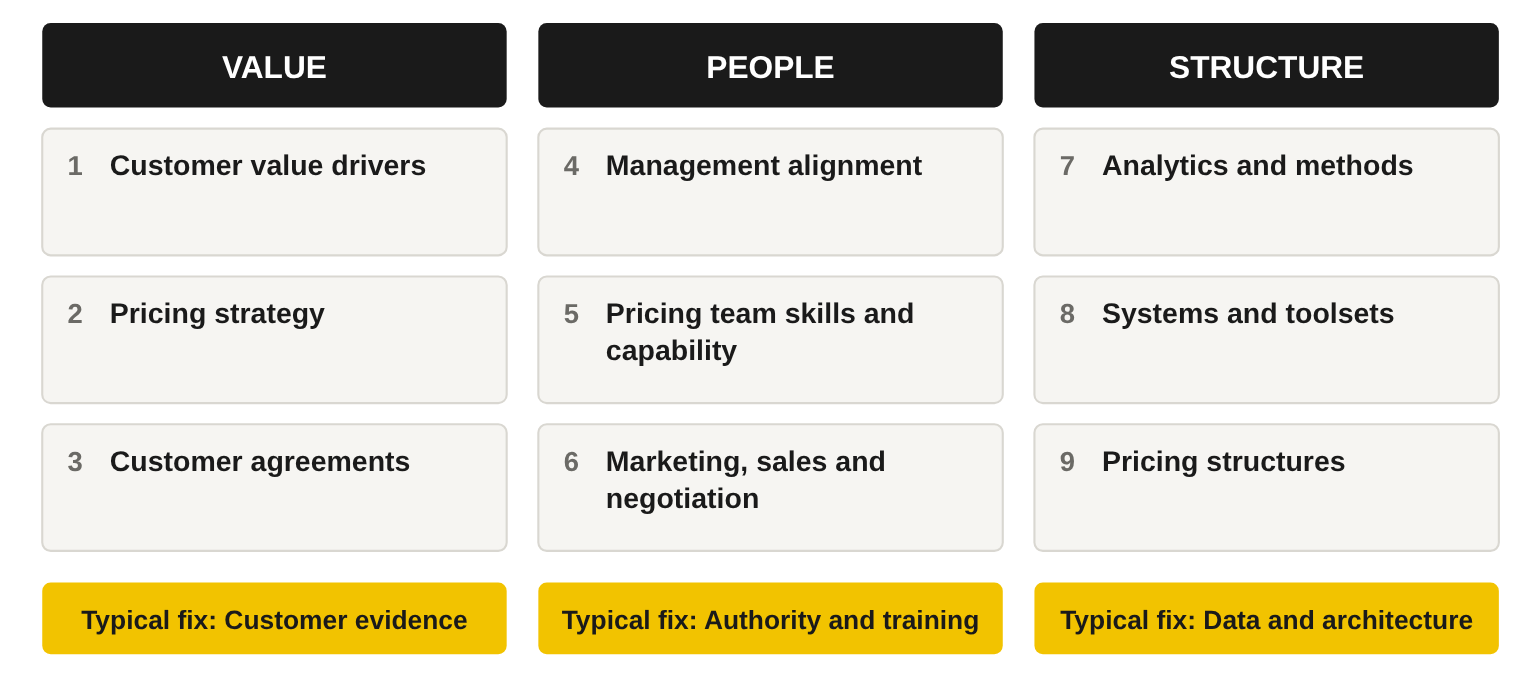
Pricing Insight 9PE diagnostic canvas: nine domains, scored through an employee survey of up to 55 capability statements.
Each domain is scored through a confidential employee survey of up to 55 capability statements, a pricing mathematics quiz and open-ended questions. The survey goes to everyone who influences price: sales, marketing, product, customer service, finance and leadership. In practice this means anywhere from several dozen to several hundred people.
The three headings matter because the fixes are different. A value problem needs customer evidence. A people problem needs authority, alignment and training. A structure problem needs data, systems and price architecture. Treating a structure problem with sales training produces a better-trained team working inside the same broken price lists.
What does the evidence say about typical pricing capability?
Across six completed client diagnostics, overall capability scores fall in a narrow band. Five of the six sit between 59.8 and 62.4 per cent. The sixth, an architectural hardware manufacturer, scored 53.6 per cent.
Figure 4. Overall pricing capability, by client diagnostic
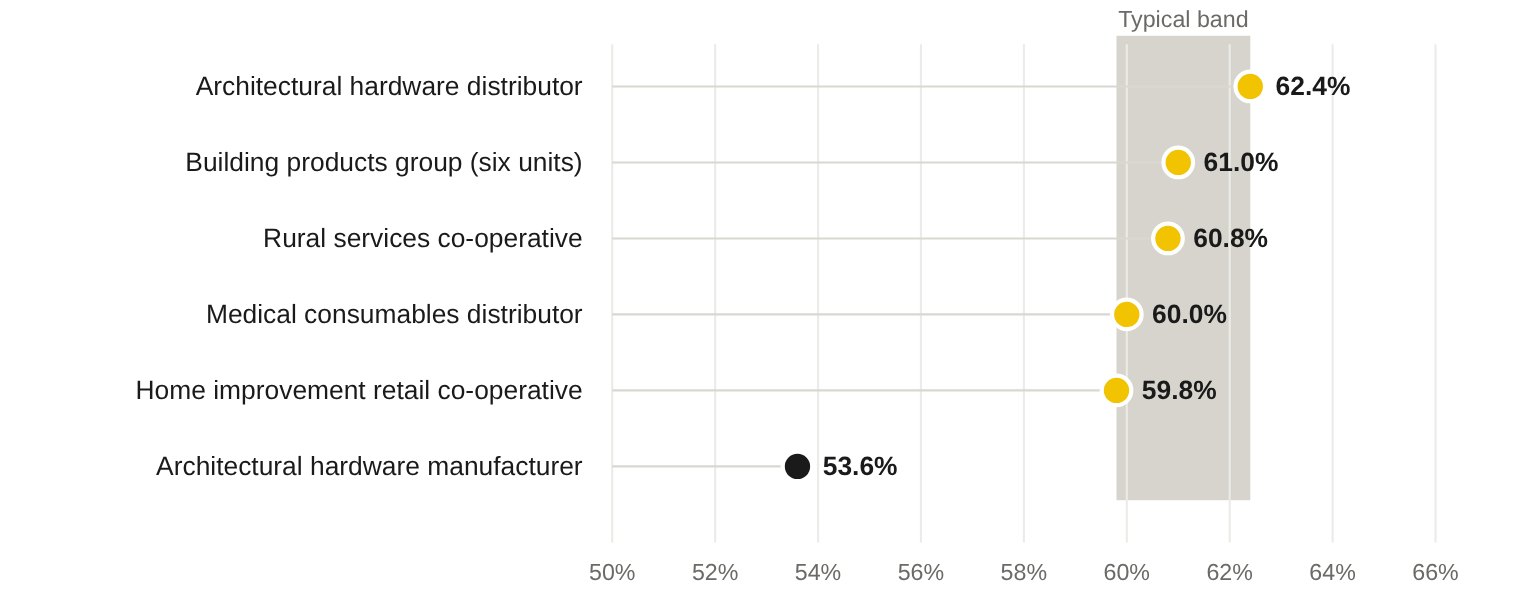
Basis: Pricing Insight cross-client benchmark register, six diagnostics, normalised 0–100% from 1–9 agreement ratings. All scores taken before training.
The consistency is itself a finding. Building products, hardware distribution, rural services, medical consumables and retail co-operatives all land in the same range before any training or redesign. Pricing capability gaps are structural features of business-to-business trading companies. They respond to the same interventions.
The domain view shows where the weakness concentrates. Pooled across the diagnostic datasets, the weakest areas are review cadence, sales enablement, margin outcomes and governance. The strongest are value communication, price-increase management and roles and resources.
Figure 5. Share of unfavourable ratings, by pricing domain
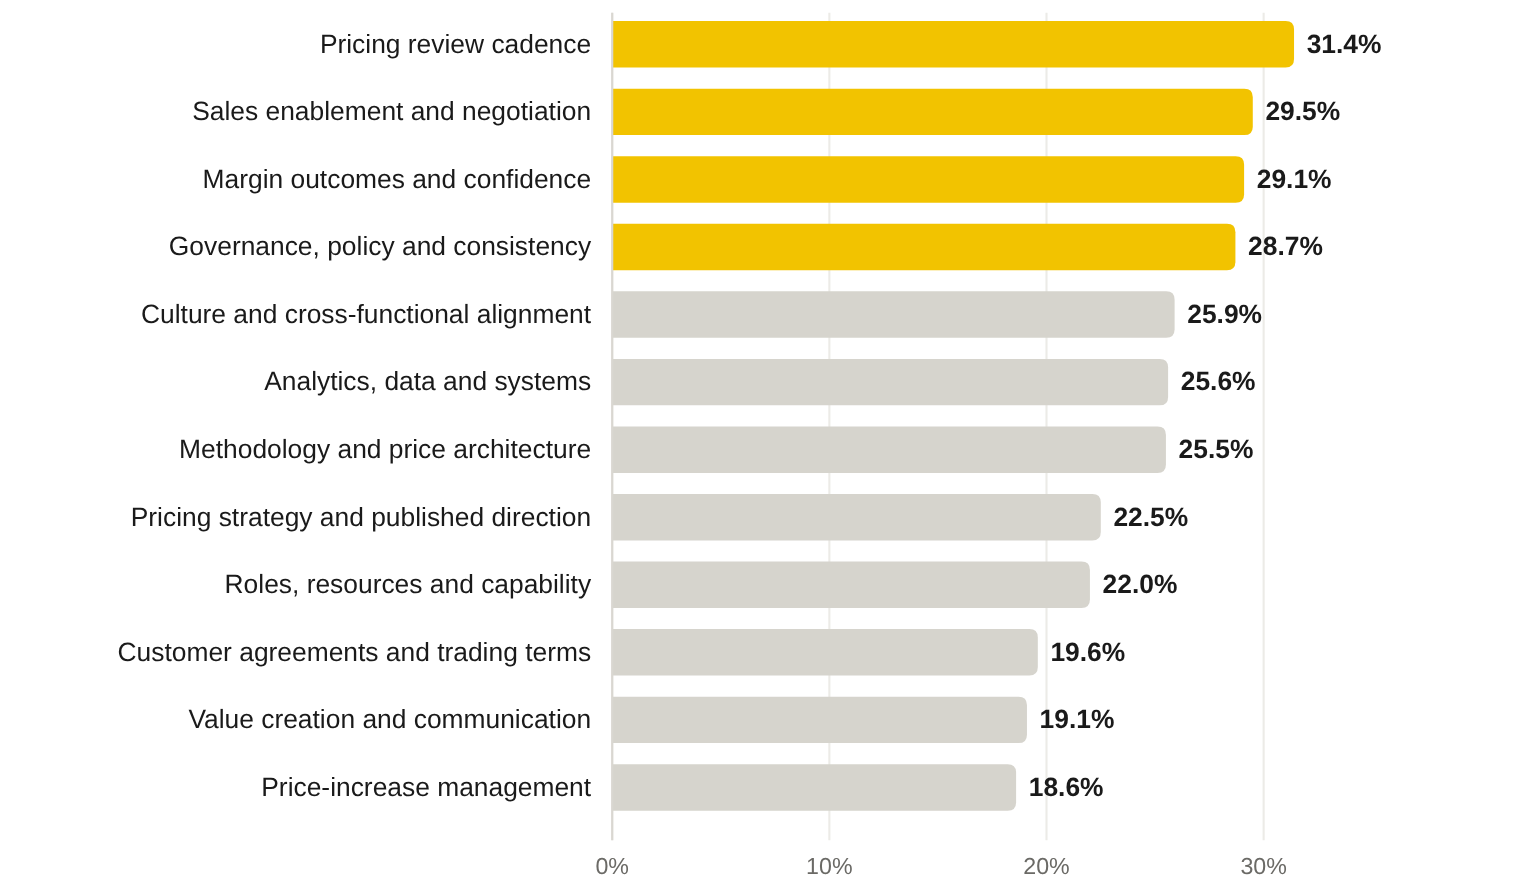
Basis: Pricing Insight cross-client themes analysis of diagnostic survey ratings, pooled across client datasets. The four weakest domains are highlighted.
One statement stands out. “We have a centralised database to track competitor pricing” was the weakest or near-weakest statement in seven of eight datasets, with an average score of 4.0 out of 9. Most businesses price without a shared view of where competitors sit. Decisions about matching, holding or leading on price are then made one quote at a time.
What do the people inside the business say?
Scores show the size of a gap. Comments explain it. Pricing Insight codes every written comment against a 40-code issue taxonomy built from the 9PE canvas and the sixteen pricing techniques. Across the register of 810 respondents and 4,721 comments, the same issues recur. Nine of the ten most frequent issues appear in all eight diagnostics.
Figure 6. The ten most-mentioned issues in employee comments
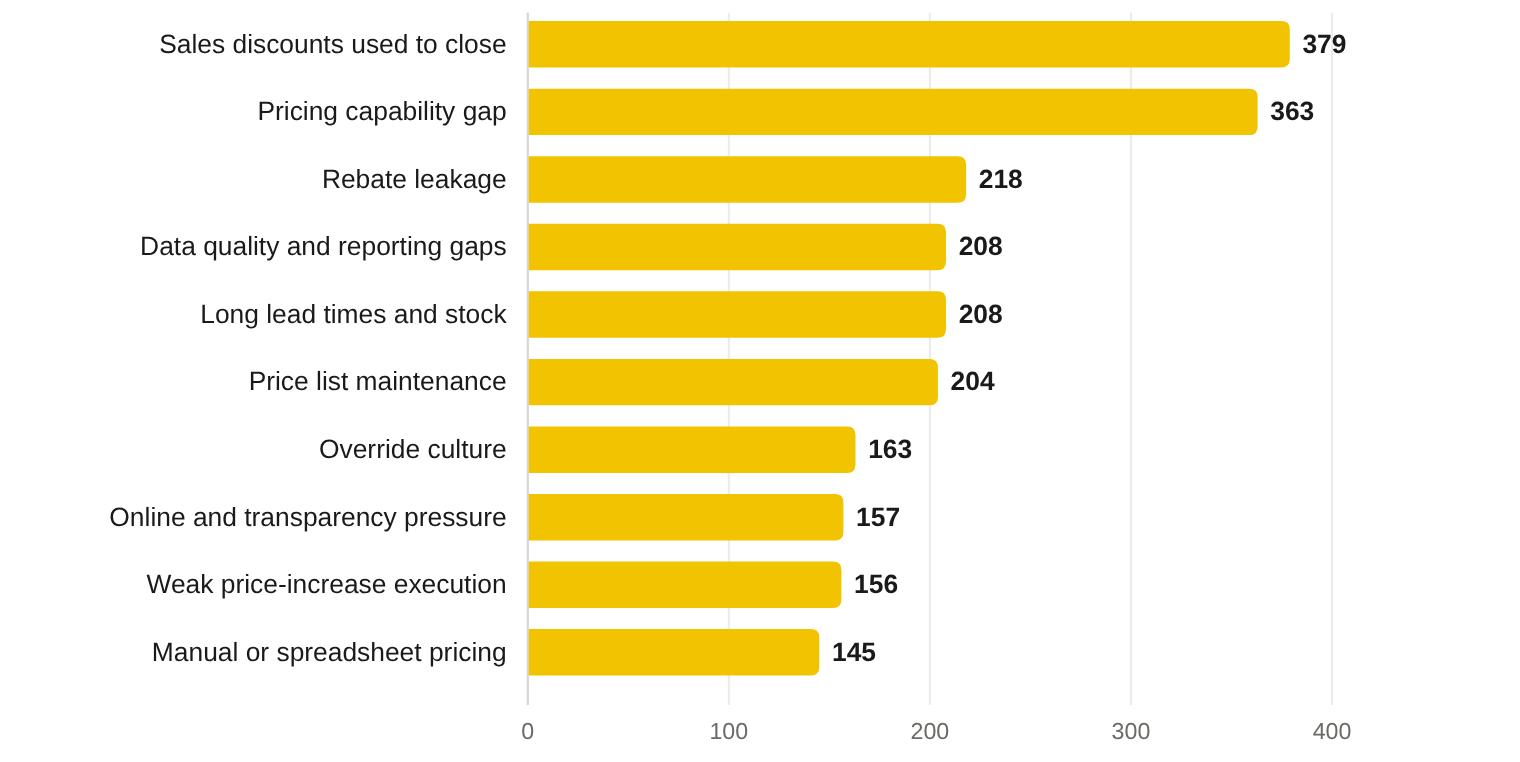
Basis: Pricing Insight cross-client register, 810 respondents and 4,721 comments across eight diagnostics, coded to a 40-code issue taxonomy. Counts are mentions; one comment can raise several issues.
The comments are specific. A sales consultant at a hardware manufacturer wrote that “customers seem to think the one discount structure applies to all products.” A colleague set out the remedy in one line: “one price list. Discount dependant on customer value – no more than 3–5 different discount levels.” In an insulation business, a manager put it more briefly: “We don’t have a retail price list, which is really Sales 1.01.”
The emotional tone of the comments is a second, less obvious finding. Each comment is tagged for expressions of fear, such as fear of losing customers or of being exposed, and for expressions of optimism, such as openness to new tools or belief that improvement is possible.
Figure 7. Optimism and fear in what employees write about pricing
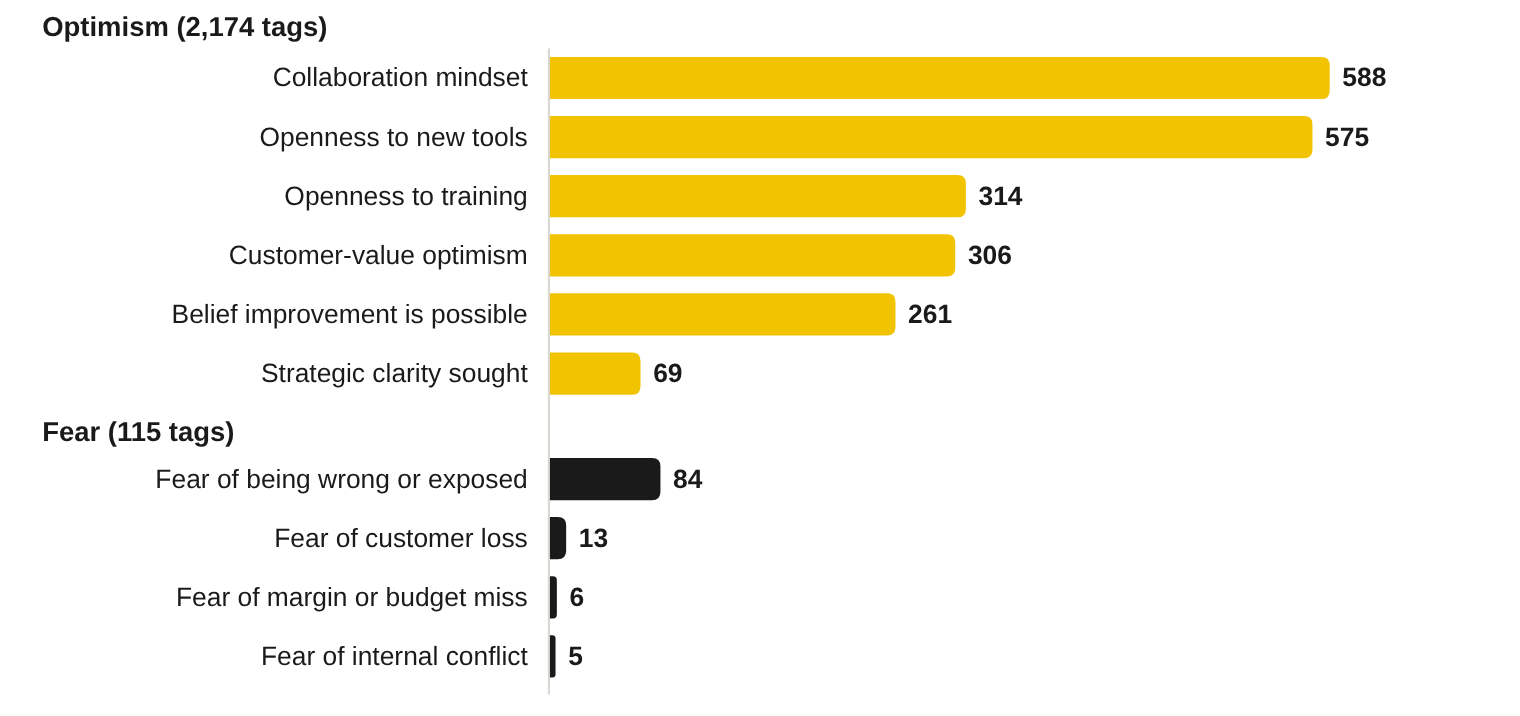
Basis: Pricing Insight cross-client register, emotional tags across 810 respondents. Categories with fewer than five tags are omitted.
Optimism outnumbers fear by roughly nineteen to one. Employees describe the problem clearly and want it fixed. In a rural services co-operative, the statement that the business could implement new initiatives to improve revenue and margin scored 86.4 per cent, the strongest openness-to-change result in the register. The constraint lies in structure, tools and authority.
The differentiation paradox
The most reliable pattern in the register concerns how businesses see themselves. Asked whether their products are commodities, employees answer firmly that they are differentiated. Asked how prices are set, they describe cost-plus.
Figure 8. The differentiation paradox
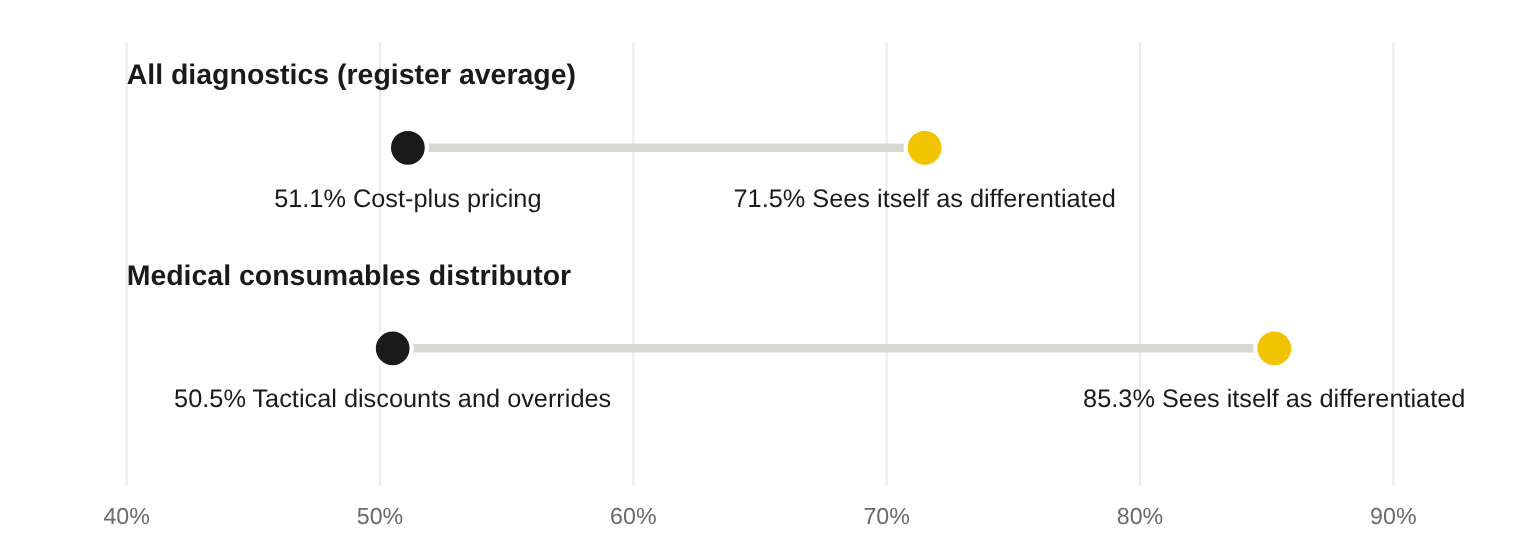
Basis: Pricing Insight cross-client benchmark register, technique scores normalised 0–100%. A higher commodity-mindset score means staff see the offer as differentiated. The cost-plus average covers the diagnostics where it was measured.
Commodity mindset is the strongest technique score in the register, averaging 71.5 per cent. Cost-plus pricing, where measured, is the weakest at 51.1 per cent. The business believes it delivers more value than competitors, then prices from its own costs and leaves the difference with the customer.
A medical consumables distributor shows the pattern at its sharpest. It recorded the highest commodity-mindset score in the register, 85.3 per cent, consistent with genuinely differentiated clinical products. The same business recorded the weakest score on tactical discounts and price overrides, 50.5 per cent. The value was understood. The discount discipline to hold it was missing.
Can the team do the pricing mathematics?
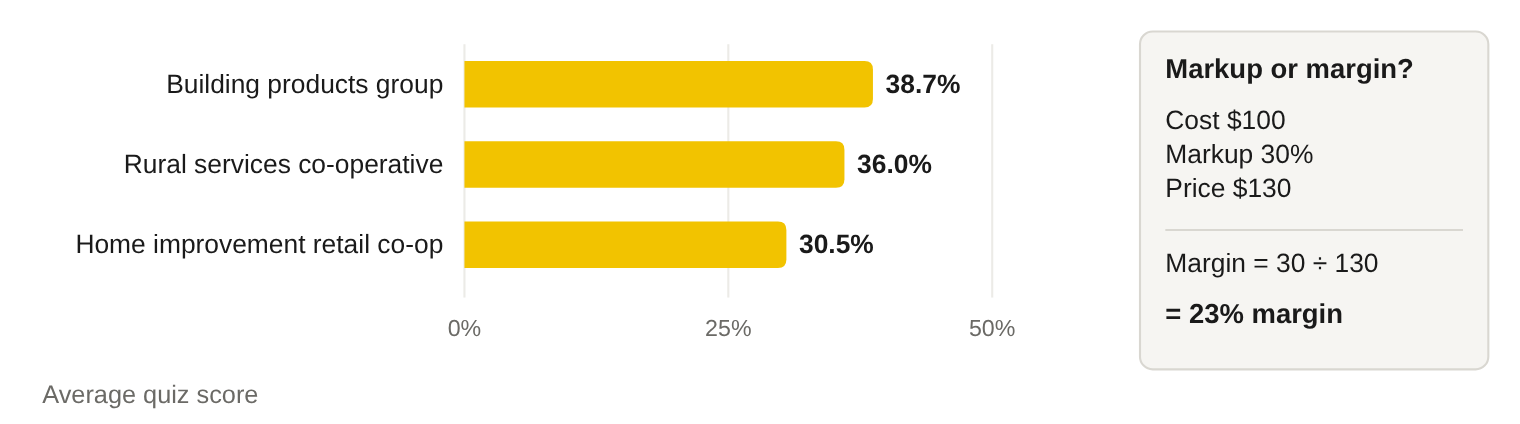
Every diagnostic includes a short pricing mathematics quiz. It tests the calculations that sit behind daily price decisions: margin and markup, the volume needed to recover a discount, and list-to-net arithmetic.
Figure 9. Pricing mathematics quiz: average scores
Basis: Pricing Insight diagnostic pricing mathematics quiz results, three client diagnostics.
Average scores range from 30.5 to 38.7 per cent. In the rural services co-operative, 2 per cent of respondents answered every question correctly. In an architectural hardware manufacturer, 27 per cent correctly calculated gross margin from cost.
The most common error is treating markup as margin. A product bought for $100 and sold with a 30 per cent markup sells for $130. Its gross margin is 23 per cent. A salesperson targeting “30 per cent” on that basis under-prices every quote by seven points of margin. Across thousands of quotes a year, the arithmetic error alone becomes a material earnings gap.
What do 1,000 Pricing University learners say about margin?
Pricing University learners complete a written exercise at the end of each lesson, applying the concept to their own business. Across 70 lesson surveys, 1,014 learners wrote 31,677 responses, of which 26,253 describe a margin idea or a margin risk. Each tagged idea was mapped to the 9PE domain it addresses.
Figure 10. Where Pricing University learners find margin
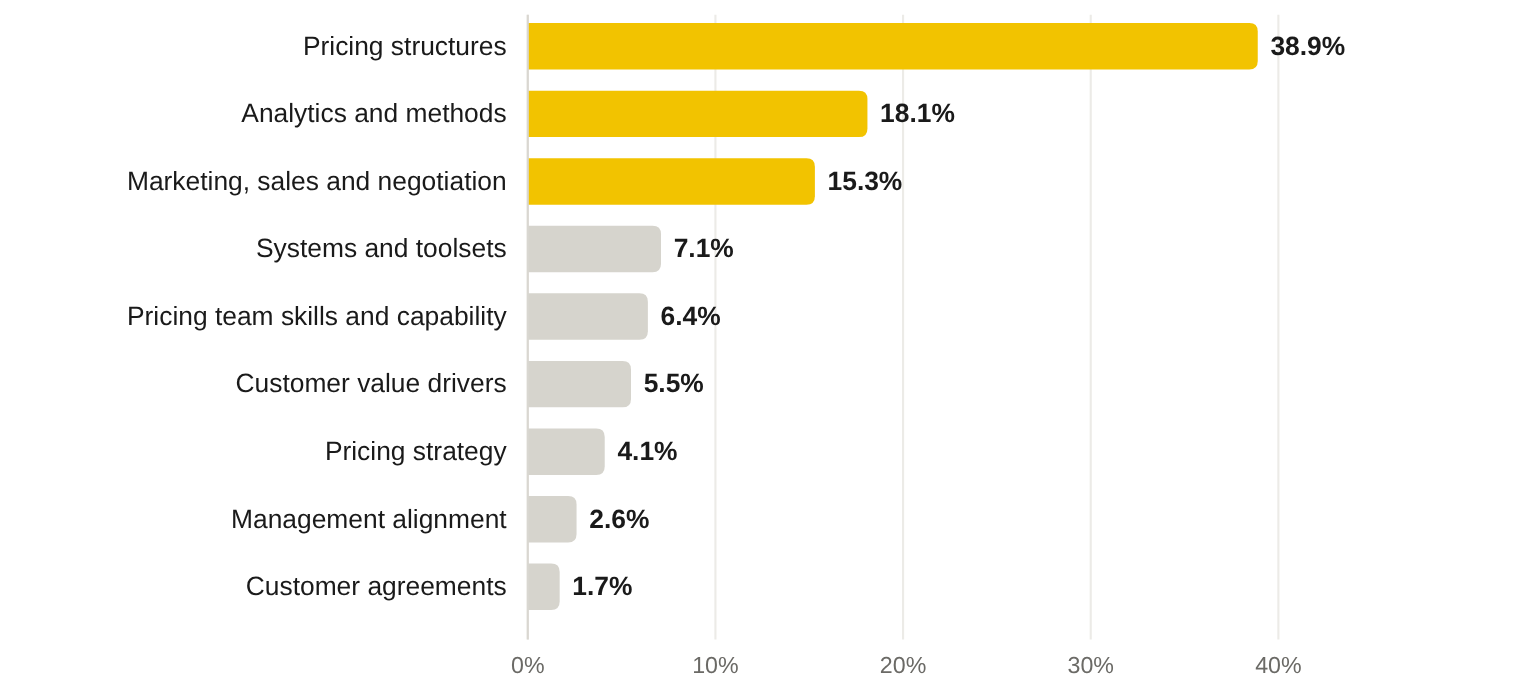
Basis: 1,014 Pricing University learners, 70 end-of-lesson surveys; 14,473 margin ideas tagged to a 9PE domain. Shares of tagged ideas.
Learners locate most of the opportunity in structure. Pricing structures account for 38.9 per cent of tagged ideas, led by rebate review and restructure (2,118 mentions from 671 learners), price increase and cost recovery, list price architecture and freight recovery. Analytics and methods follows at 18.1 per cent, dominated by competitor benchmarking.
The ideas are practical. One learner wrote: “If we had the list prices set up correctly then we could base the discount levels on a number of categories to stop us from sacrificing margin.” Another proposed to “profile and score customers based on a number of important traits,” gearing rebates to reward the customers who contribute most. A third described the override problem in a single sentence: a lower pricing-power customer reports a competitor price $2.50 lower on copper, “so I just override price.”
Each of those ideas corresponds to a method Pricing Insight uses in consulting work. The learners have identified the problem. The methods below give them a repeatable way to fix it.
Which methods solve which pricing problems?
Pricing Insight’s methodology is organised around sixteen techniques: eight that expand margin and eight that erode it. Each issue in the register maps to one or more techniques and to a defined first fix.
Figure 11. From issue to method to first fix
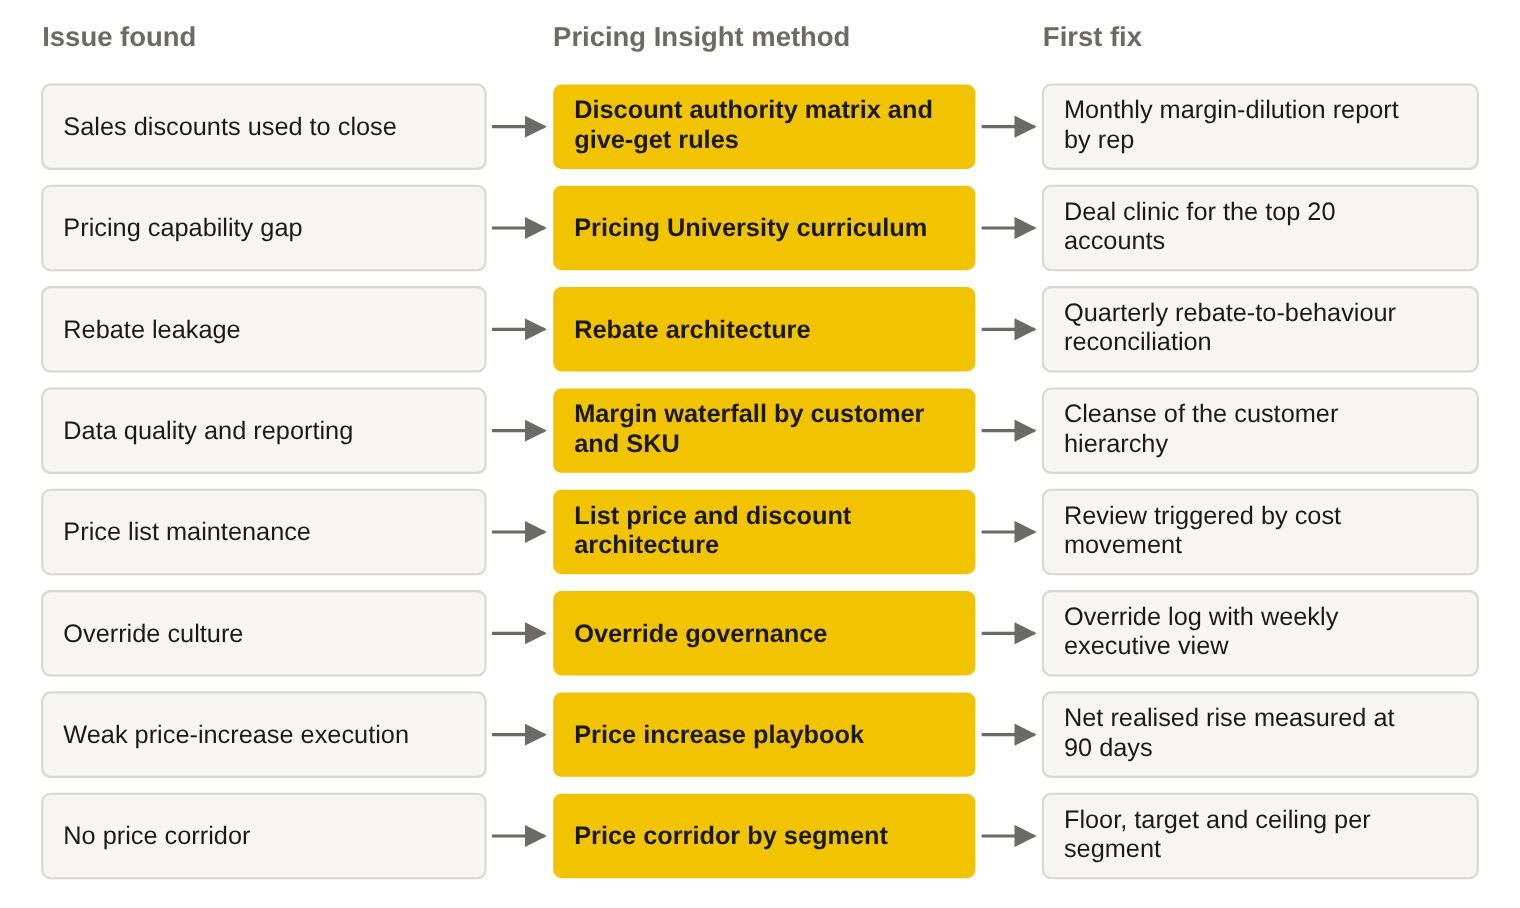
Basis: Pricing Insight issue taxonomy and quick-wins library.
Five methods carry most of the work.
Price corridors. A corridor sets a floor, a target and a ceiling for each customer segment and product group. Prices inside the corridor need no approval. Prices below the floor need a reason code and a named approver. Figure 12 shows the typical before-state: similar customers paying widely different prices, with no relationship to volume or value.
Figure 12. A price corridor laid over typical customer pricing
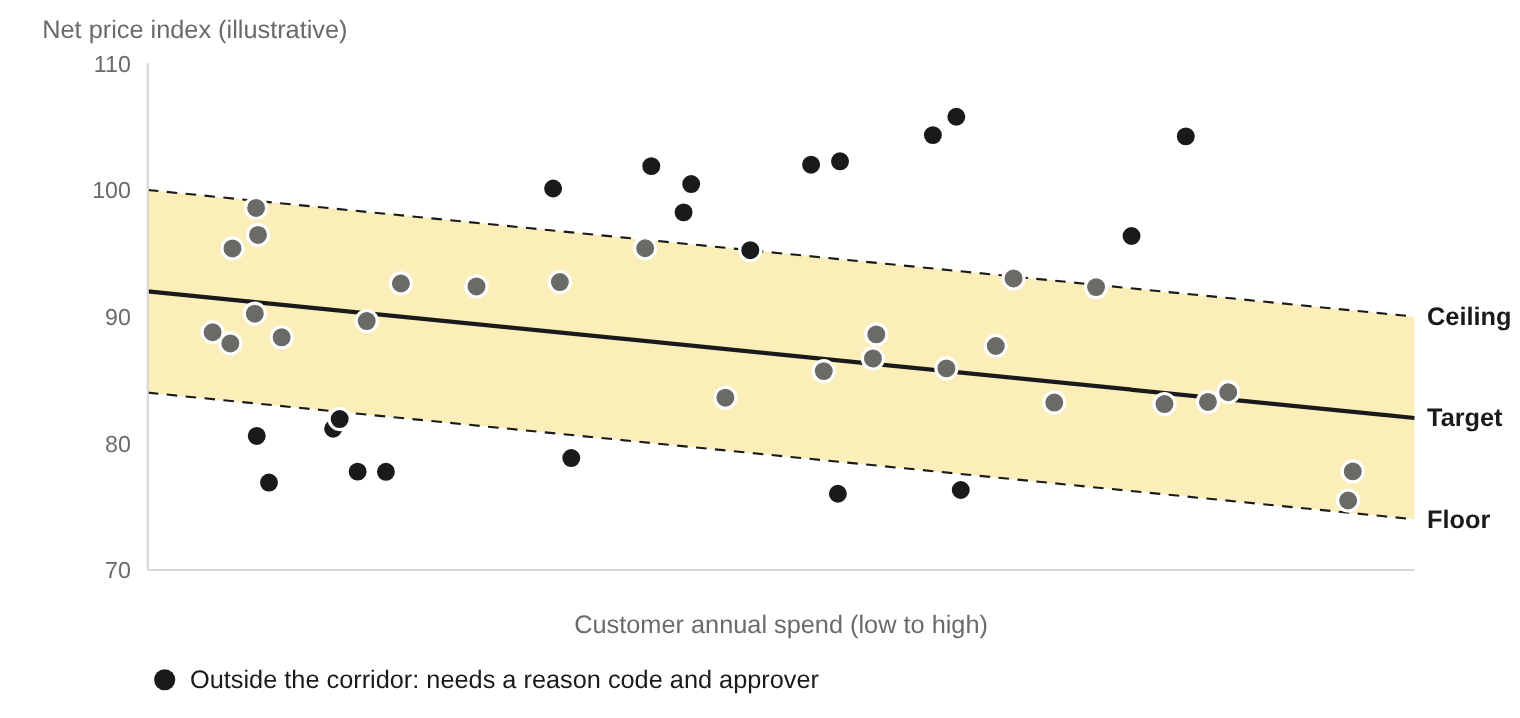
Illustrative. Each dot is a customer's net price on a comparable product group.
List price and discount architecture. A product hierarchy is set against a customer hierarchy. Discounts are set at the intersections, at the highest level that still reflects real differences in value. This replaces large numbers of individual customer-SKU prices with a much smaller set of rules. It is the foundation on which the other methods run.
Figure 13. List price and discount architecture: product hierarchy by customer hierarchy
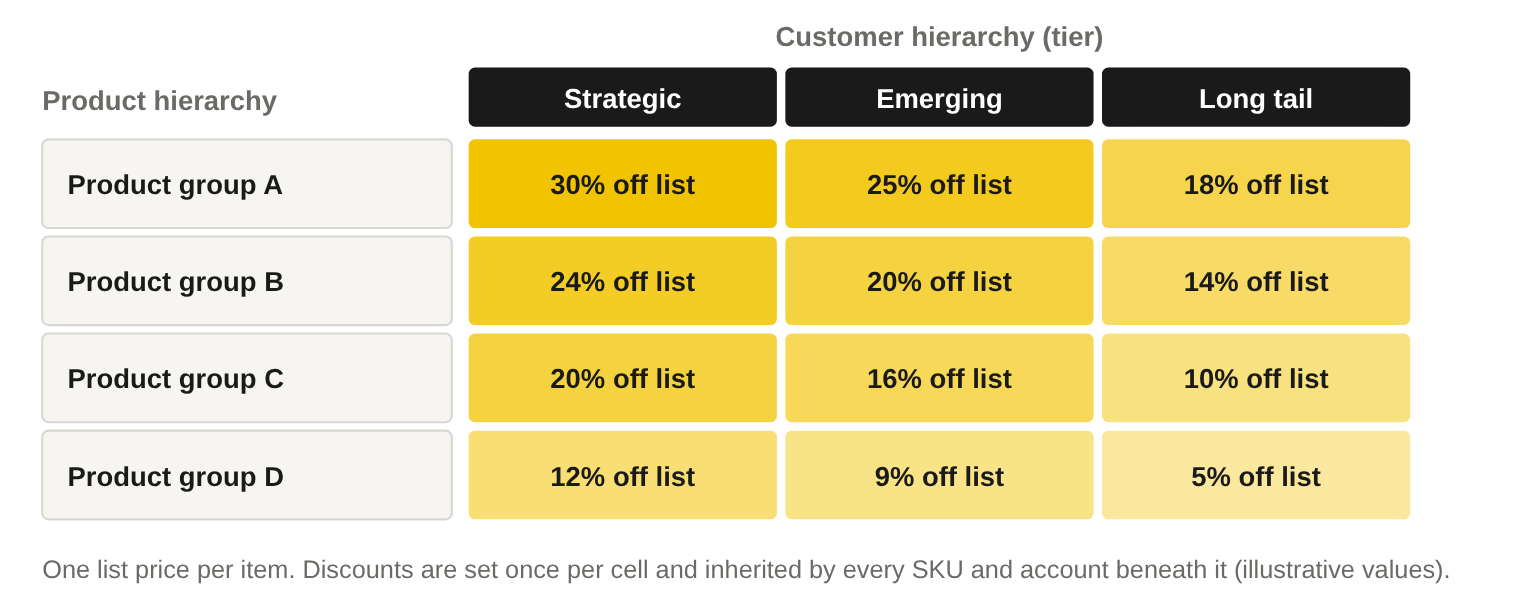
Illustrative structure and values.
Customer pricing power scoring. Blackbird, Pricing Insight’s price optimisation engine, scores each customer from 0 to 10 on pricing power using data already held in the enterprise resource planning (ERP) system. Five dimensions are weighted: switching cost, price awareness, relationship depth, growth trajectory and profitability. Each customer then falls into one of four tiers, and each tier carries a different pricing action.
Figure 14. Customer pricing power: the Blackbird scoring model
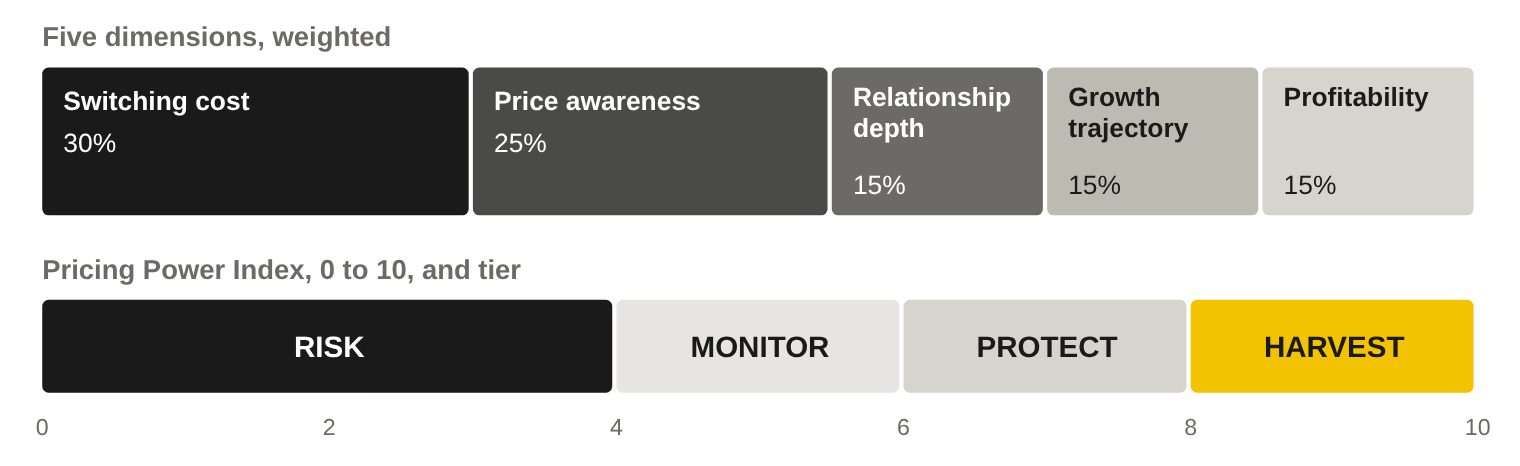
Pricing Insight Pricing Power Index. All fields are derived from ERP transaction data.
Discount authority matrix. Approval limits are set by dollar value and margin impact. Every override is logged and reviewed. Out-of-policy exceptions are reported to executives each month.
Price increase playbook. Increases are sequenced by customer tier and product role. Each has dates, customer communication, exception rules and a freeze on further discounts after the increase. The net realised increase is measured at 90 days.
Case examples
Insulation manufacturer: 250 basis points of gross margin
An Australian insulation manufacturer within a listed building-products group took part in a group-wide diagnostic. Fifty-two of its staff responded. The business scored 58.8 per cent on the 9PE capability measure, 7.0 points behind the other five units in the group. It had no base list price. A published pricing strategy scored 41.8 per cent and competitor price tracking 36.7 per cent. Yet 86 per cent agreed margins could be improved.
Staff completed Pricing University, and the business made three changes: a new pricing structure, a price increase, and reduced discounting. Incremental gross margin rose by 250 basis points, an annualised run-rate of A$2.25 million flowing to earnings before interest, taxes, depreciation and amortisation (EBITDA).
The diagnostic came first for a reason. Across the group, capability differed sharply between units. A program built around the group average would have missed this unit’s gaps in price architecture, discount control and pricing resources.
Rural services co-operative: cost-plus in a value business
A rural services co-operative surveyed 98 employees. The statement that the sales team does not rely on cost-plus markup scored 39.3 per cent, the lowest result in that survey. The statement that the business was meeting its gross margin targets scored 47.9 per cent. The pricing mathematics average was 36 per cent.
Interviews located the leak. Staff reported seed margins of 1.5 to 3 per cent on some quotes. On some items already priced at everyday low prices, a standard 5 per cent member discount was layered on top. Agronomy advice, delivery coordination and seasonal credit carried real value for customers but were given away without a price.
The recommended response combined quick wins with structural change: a national list of key value items for each category, margin floors by product class with a reason code for any quote below the floor, a fortnightly competitor price index to replace informal price matching, and a move from markup to margin management in the ERP system. The engagement delivered NZ$6.5 million in annualised margin improvement, close to 1 per cent of revenue.
Architectural hardware: same sector, different capability
Two businesses in the same architectural hardware supply chain completed diagnostics. The distributor scored 62.4 per cent overall. The manufacturer scored 53.6 per cent, the lowest result in the register. The sharpest gap was in price-increase execution: 68.1 per cent at the distributor against 43.6 per cent at the manufacturer.
The manufacturer’s comments described price files held on a shared drive, project pricing built from templates, and a single discount structure applied across product groups. The recommended response was organisational before it was analytical: authority limits, named owners for price lists, a fortnightly pricing review, and a simplified discount structure of the kind staff had proposed in their own comments. The findings needed for each step were already in the diagnostic.
How is the work sequenced?
Pricing Insight stages the work behind decision gates, so that each phase is approved on the evidence of the one before.
Figure 15. How the work is sequenced
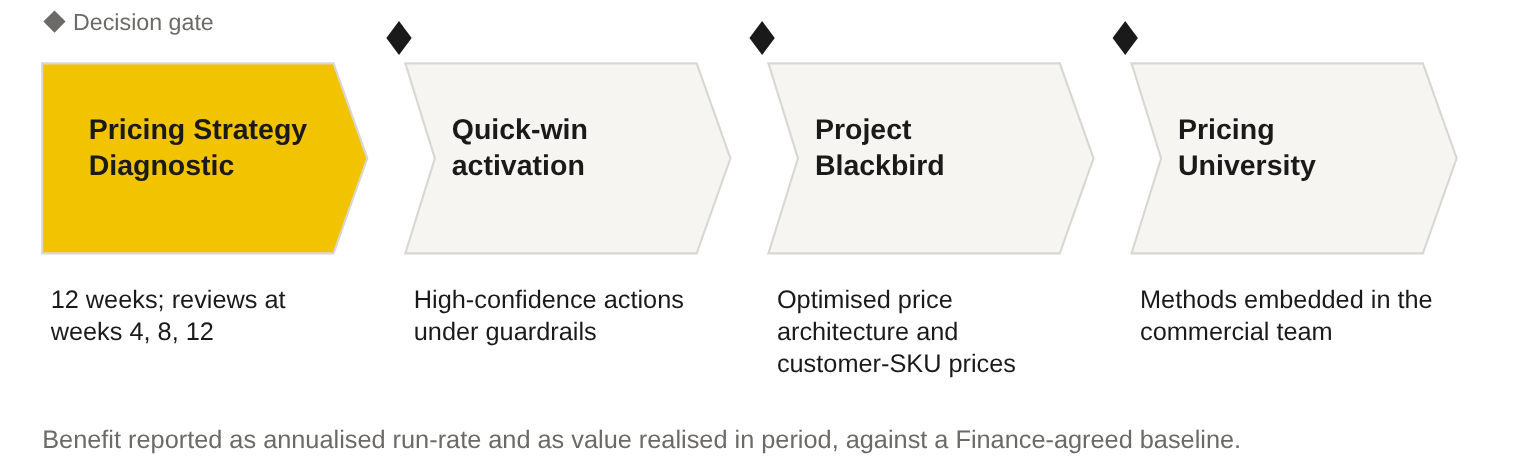
Pricing Insight engagement structure.
The Pricing Strategy Diagnostic runs for twelve weeks, with formal reviews at weeks four, eight and twelve. Quick-win activation tests a small number of high-confidence actions under agreed guardrails. Project Blackbird delivers optimised price architecture and risk-rated customer-SKU price recommendations. Pricing University embeds the methods in the commercial team, so the gains hold after the engagement closes. Every benefit figure is labelled either as an annualised run-rate at stated volumes or as the amount realised within a stated period, against a baseline Finance has agreed.
Frequently asked questions
What does a pricing expert do first?
A pricing expert locates the problem in realised price before proposing a fix. That means building a price waterfall from list price to pocket price, then running a capability diagnostic to find why the leak exists. The first output is a sized opportunity, expressed as a range in dollars and basis points, agreed with Finance.
Which pricing methods recover margin fastest?
In Pricing Insight’s experience, the fastest returns usually come from discount control, rebate reconciliation and a well-executed price increase. Each uses data the business already holds. Structural methods, such as list price and discount architecture or customer pricing power scoring, take longer and make the early gains last.
How long does a pricing diagnostic take?
A Pricing Insight Pricing Strategy Diagnostic runs for twelve weeks, with decision reviews at weeks four, eight and twelve. It combines transaction analysis, an employee capability survey, a pricing mathematics quiz, interviews and a sized list of opportunities.
About Pricing Insight
Pricing Insight is an Australian business-to-business pricing strategy consultancy based in Sydney, founded in 2007 by Ron Wood. Ron has worked in pricing for 30 years, first as a pricing manager and commercial manager in industry and then as a consultant. The firm has completed more than 160 pricing engagements across manufacturing, distribution, building materials, healthcare, retail and business services in Australia, New Zealand and Asia, and has trained more than 5,000 executives through Pricing University.
Contact: info@pricinginsight.com.au · +61 410 534 099 · pricinginsight.com
Client examples are drawn from completed Pricing Insight engagements and are identified by industry only. Diagnostic figures are from the Pricing Insight cross-client diagnostic register and Pricing University survey records. Capability scores are normalised to a 0–100 per cent scale from 1–9 agreement ratings. Comment and idea counts are keyword-coded and indicate frequency of mention.



.png)