
.webp)
Pricing change holds when the business measures its starting point first and governs the work after go-live. Pricing Insight's approach scores the Pricing Periodic Table, chooses three to five elements for the first two quarters, runs the first 90 days in three phases with a CFO-signed baseline, and names one accountable person for each pricing decision.
A large Australian office supplies distributor grew margin by about 740 basis points, realised within 12 months, and could measure the result because it measured the starting point first. How the work is chosen, measured and governed decides whether gains like this hold.
Start with a scorecard. The Pricing Periodic Table sets out 61 elements of pricing capability in nine domains, each scored from 1, not in place, to 5, best practice. Five leaders score it separately, the scores are checked against evidence, and three to five elements are chosen for the first two quarters. In diagnostic work the first choices most often come from the gaps staff raise most: discounting to close a sale, the pricing capability gap, rebates paid without a test of what they buy, and unreliable margin and rebate data.
The first 90 days run in three phases, each ending with a decision. The CFO signs a baseline before any price moves, and every result is labelled annualised or realised. A Pricing RASCI names one accountable person for each pricing decision, and a Pricing Council meets monthly and logs its decisions. Training reaches everyone who quotes, and incentives carry at least one price realisation measure.
Why do pricing gains fade?
Seven reasons for the fade. No one owns the result after go-live. Rules are imposed and then worked around. Overrides creep back unseen. Incentives still pay on revenue. Price files are not maintained. New starters are not trained. Leaders stop asking.
At the office supplies distributor, margin had shrunk by about 1.5 per cent even as revenue grew, so a revenue report would have looked healthy. Value-based algorithmic pricing then set one recommended net price for each customer and product across about 5,000 products, and margin grew by about 740 basis points within 12 months. A basis point is one-hundredth of a per cent.
Staff describe the conditions that cause the fade:
What people say
"People are reluctant and resistant to change. Strong disciplines are required as the 'old school' mentality still persists."
"At the moment there isn't a culture to maximise profitability. Due to the current economic climate a sale is a sale that's desperately needed."
"sales team and pricing team have different goals and KPI"
How does the Pricing Periodic Table scorecard work?
Sixty-one elements, each with one test question, each scored from 1 to 5 against what the business does today, not what it plans or what a policy says. A score of 1 means nothing exists, or it exists only in one person's head. A score of 3 means it is written and available but applied unevenly across branches, teams or customers. A score of 5 means it is measured, reviewed on a fixed date and improved.
Nine domains, under three pillars. Value covers Customer Value, Pricing Strategy and Customer Agreements. People covers Management Alignment, Pricing Team and Market, Sales & Negotiation. Structures covers Analysis & Processes, Price Architecture and Systems & Controls. Each domain score is the average of its elements.
Five people score, each alone, in about an hour: the CEO, CFO, Sales Director, Marketing Director and Pricing Manager. They then set the five scores for each element side by side, with the average and the spread between the highest and lowest. Elements with a spread of two points or more are discussed first, because a wide spread usually means one role holds a fact the others lack.
Two checks keep the scores honest. A score of 4 or 5 needs a document, report or record to support it. A low score from one person is not proof that the element is missing, because a policy may exist that the scorer has never seen; in that case test separately whether it is written down, whether the people who quote can reach it and whether they use it. Scores are then checked against sales data.
In a timber and building-products distributor's course surveys, leaders named the causes: a cost-plus culture, weak override discipline and no pricing function. Sales staff described the same problems as events at the counter, such as cash buyers on the trade rate, part packs sold at pack rates and urgent orders priced at average margin.
Read the pillar averages before single elements. Low Value scores usually mean the business cannot state, in the customer's dollars, why it is worth more, and its agreements record price alone. Low People scores usually mean pricing decisions have no clear owner, sellers work without a walk-away price or the arithmetic to test a discount, and incentives pay on revenue. Low Structures scores usually mean nobody can see the net price, overrides go untracked and quotes are built in spreadsheets.
Where do most businesses start?
In the figure, the table is shaded by how often staff raised each gap in diagnostic surveys of business-to-business manufacturers and distributors. The darkest cells, raised most often, are Delivery reliability and value at risk, Segment and channel strategy, Online and price transparency, Rebate and incentive design, Commercial numeracy, Discount structure and tiers, and Discount authority and controls. Unshaded cells, such as Value-based agreements, Pricing council and Deal desk and negotiation governance, are rarely named by staff. They are still common gaps, but because they sit with leadership or in the numbers they are found through analysis and course work rather than in survey answers.
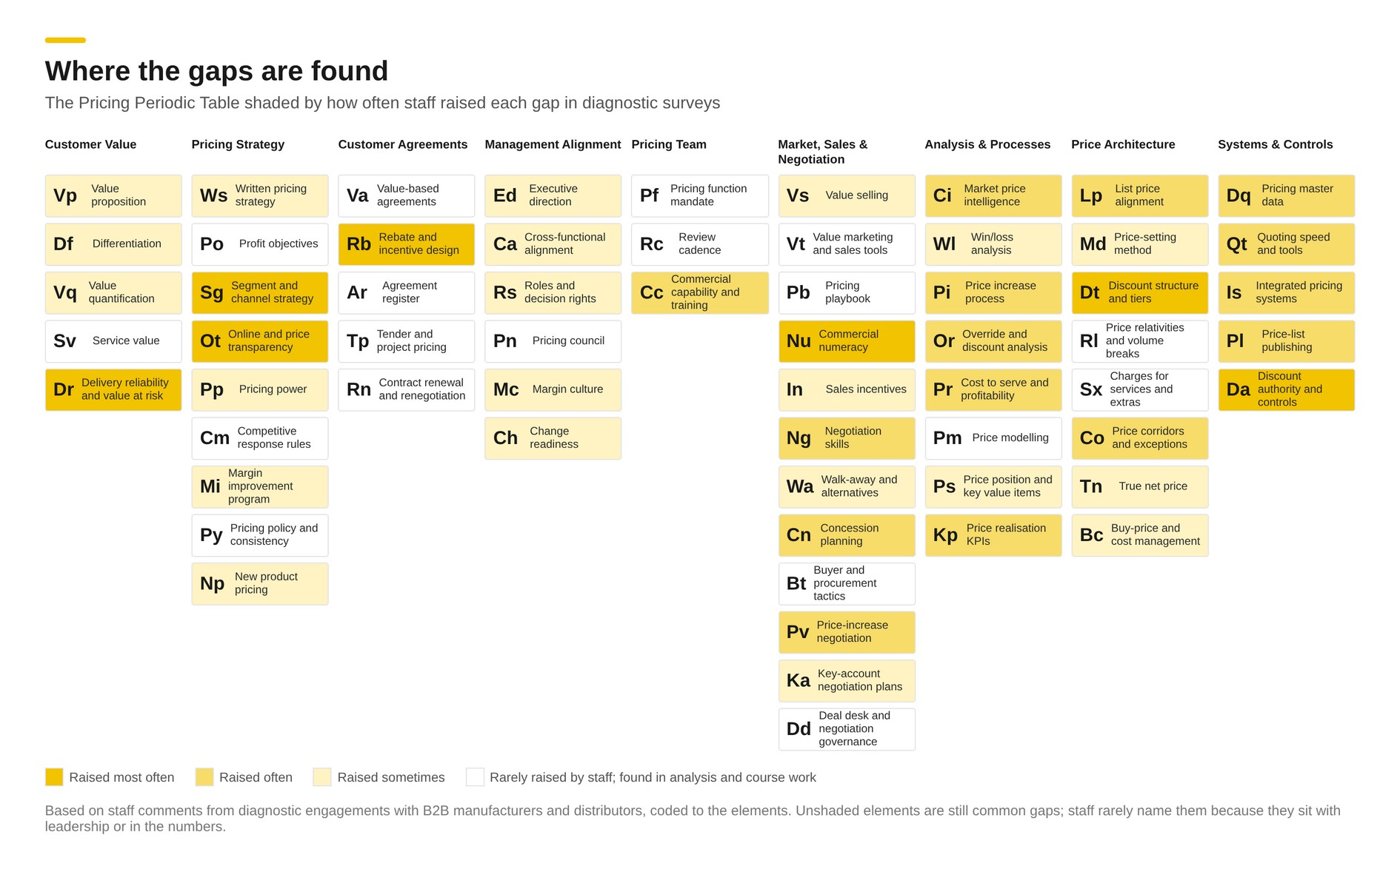
Figure 1. Where the gaps are found: the Pricing Periodic Table shaded by how often staff raised each gap in diagnostic surveys.
Check any high score in an unshaded cell a second time, since staff seldom see those gaps from where they work.
Across diagnostic engagements, the gaps raised most often are, in order: discounting to close a sale; the pricing capability gap; rebates paid without checking the behaviour they buy; unreliable margin and rebate data; supply and stock problems that force concessions; price lists not maintained; a culture of overrides; and online price transparency. Start with one or two of the first four, which show up in the data within weeks and are close to the money, unless the business's own scores point elsewhere.
Five levels of pricing capability are shown in the next figure. At level 1 pricing is ad hoc and depends on memory, and margin risk is very high. At level 2 some basic processes exist but rely on individual skill. Level 3 documents key processes and tools, level 4 adds measures and a resourced pricing team, and level 5 improves itself, with very low margin risk. In our experience most business-to-business pricing functions are at level 2. A realistic aim is level 3 within 12 months and level 4 within 24.
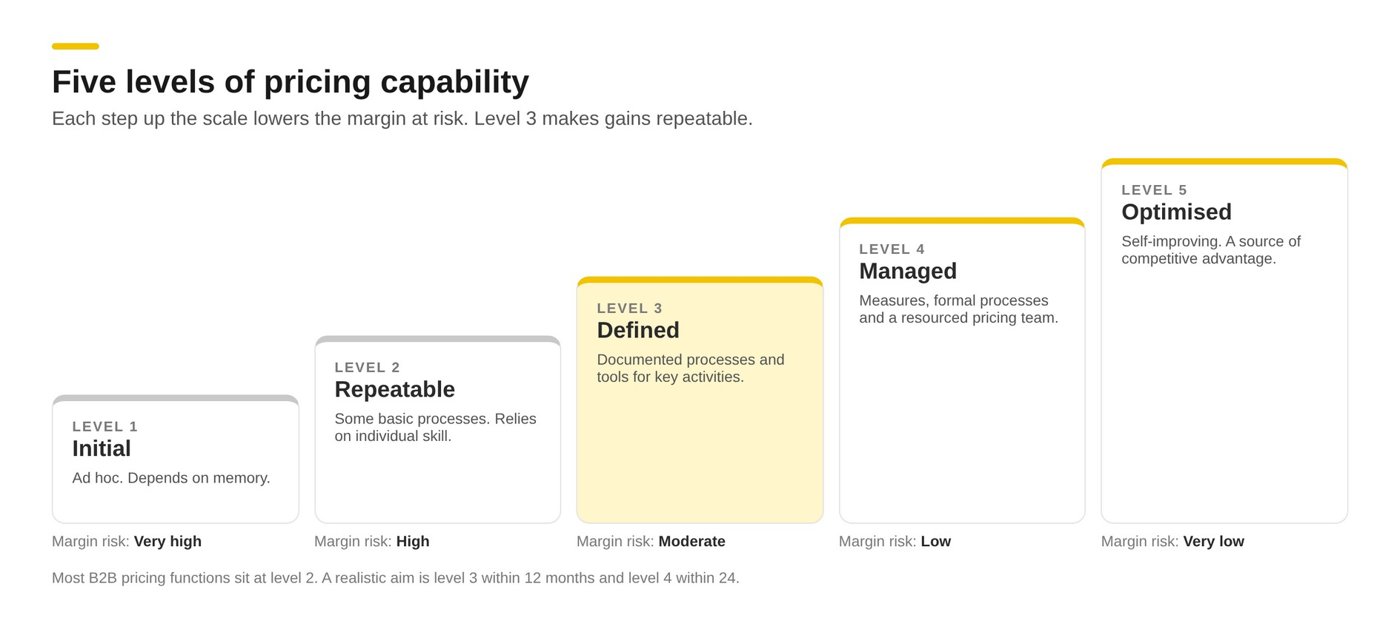
Figure 2. Five levels of pricing capability: each step up the scale lowers the margin at risk.
Weak elements are then sorted into three groups. The money covers prices that are visibly wrong today, such as dormant special prices or an increase that never reached the invoice. The controls cover discount authority, an owned price file and a report on price realised. The capability covers what makes the first two last, such as commercial numeracy and a written pricing strategy. A good first choice takes one or two items from each group.
Sometimes the organisation has to come first. An Australian manufacturer of door hardware, lever sets and locks kept price files on a shared drive and had one discount structure for every product group. The recommendation was to set authority limits, named owners for price lists, a fortnightly pricing review and a simpler discount structure before any analysis began. Staff had proposed that structure themselves: "one price list. Discount dependent on customer value: no more than 3–5 different discount levels." The recommendation has not yet been measured.
What happens in the first 90 days?
Ninety days, in three phases, each ending with a decision. For each phase, the focus is followed by the decision taken at the end.
- Days 1–30: scorecard completed and compared; three to five elements chosen; Finance baseline; owners named; quick wins chosen. Decision at the end: which elements and actions go ahead, with which exclusions.
- Days 31–60: quick wins released in stages; Pricing Council and RASCI in place. Decision at the end: whether the controls are holding.
- Days 61–90: first realisation report; pilot reviewed; chosen elements re-scored. Decision at the end: extend, adjust or stop.
In the first two weeks the five leaders complete the scorecard and meet to compare, ending with three to five elements, each with one owner and one observable practice that will show it is working, such as an approval log, a published price file or a monthly realisation report. In the same 30 days the CFO signs the baseline.
Quick wins start where the money is concentrated. In many businesses about 20 per cent of customers or products carry about 80 per cent of revenue, and within that group about 4 per cent carry about 64 per cent. An Australian distributor of branded hand tools and workshop equipment chose its actions at a checkpoint in week three. Each needed agreed economics, customer exclusions, a named owner, approval limits and a Finance baseline. Changes were released by customer group, with realised gains and the full-year run rate tracked separately. The target was at least A$1.0 million of extra EBITDA (operating profit before depreciation and amortisation) a year. No result has been reported yet; the business decided in advance what it would count.
Pilots test the structure before the largest accounts are touched. An Australian trade distributor of cabinet and architectural hardware ran two. Lighting was small and deliberately low risk, and its category team rebuilt 37 old product families into 8. Drawer systems were about a third of revenue and the most tightly priced category. One checkpoint was set before the rollout could extend: a live price book with the price ceiling working in the system, not a spreadsheet showing the right answer. After the pilot, about four-fifths of the margin found was in categories not yet released. The proposed rollout ran in three waves, with measurement rules agreed with Finance beforehand, weekly watch on volume and lost customers, and a written stop rule. The rollout gain is projected, not yet realised.
Month three brings the first realisation report. The same five people re-score the chosen elements against the same evidence, so the board sees movement on the scorecard beside movement in margin.
How do the RASCI and the Pricing Council govern pricing?
The Pricing RASCI closes the gap in which sales assumes finance set the floor and finance assumes sales will hold it. It names one accountable person for each decision; the letters stand for Responsible, Accountable, Supporting, Consulted and Informed. The CEO is accountable for four decisions: pricing strategy and price position, the value proposition, segment and channel rules, and the governance rhythm. The CFO is accountable for the economics and limits, including margin targets, discount authority and floors, rebate budgets, incentive design, realisation reporting, cost to serve and deal exceptions above authority limits. With deal exceptions placed with the CFO, the person who wants the deal is not the person who approves it. Directors and the pricing manager own the detail.
Five monthly questions for the CEO:
Checklist
- Do we know which customers and products we will hold price on, and which we will compete for?
- Does every concession carry a defined return, written down before it is given?
- Does each rep know the walk-away price before entering the room?
- Which decisions reach me that the RASCI says belong elsewhere?
- When someone held price and lost an order, did we back them?
For the CFO, every benefit is labelled annualised, a full-year run rate at stated volumes, or realised, what arrived in a stated period. Fixed sets of customer-product pairs strip out volume and mix. Buying savings are kept apart from selling-price gains, and a discount correction and a list-price change describing the same net-price movement are counted once.
The numbers: illustrative figures
- Planned increase: 4 per cent on A$50 million of affected revenue = A$2.0 million annualised.
- Invoiced at the 90-day check: 3 per cent = A$1.5 million annualised.
- Increase realisation: 3 ÷ 4 = 75 per cent, a gap of A$0.5 million a year.
- A gap found at the 90-day check can still be recovered; at year end it has become the new base.
Four measures are enough to start: price realisation against target, the list-to-pocket gap, override share and increase realisation, each reported monthly by customer, product and rep.
A Pricing Council makes, records and reviews the pricing decisions that cross functions, meeting monthly during a rollout and at least quarterly after that, with a charter, named members and a standing agenda. One council's single test was that 95 per cent or more of prices below the floor should carry an approval and a reason code. Each decision is logged with its owner and a check date, and escalation must be faster than working around the rules. Around the council runs a wider review cadence: weekly review of exceptions, monthly review of realisation and the decision log, quarterly review of price position and competitor moves, and an annual setting of the increase and the strategy.
How do capability and incentives keep the gains?
Commercial capability and training has to reach everyone who quotes. A building-materials group trained its whole commercial team, and margin rose by about 400 basis points over the program (realised). A retail group's category managers and planners, who set prices and promotions with no common method, completed a structured pricing course, and margin grew by about 270 basis points against the prior year (realised, published case result); other changes in that year were not separated out.
Training is measured in four steps: completion, demonstrated understanding, observed use on live deals and results reconciled by Finance. A medical consumables maker whose pricing manager resigned during a major project approved extra headcount at once, so the logic of the pricing model would not leave with the departing manager.
Where reps are paid on revenue alone, the CFO should add at least one realisation measure to the sales scorecard at the next plan reset.
Which Pricing Periodic Table elements does this paper cover?
- Kp Price realisation KPIs: Price realisation, the list-to-pocket gap, override share and increase realisation reported monthly, every result labelled annualised or realised
- Pn Pricing council: A cross-functional council meets on a fixed schedule to a standing agenda and logs each decision with an owner and check date
- Rs Roles and decision rights: A signed Pricing RASCI names one accountable owner for each pricing decision
- Cc Commercial capability and training: Everyone who quotes is trained through a set curriculum and coaching on live deals, with cover for key pricing roles
- In Sales incentives: Incentives and KPIs reward margin and price realisation as well as revenue
- Rc Review cadence: Prices, margins, exceptions and market moves reviewed on a fixed weekly, monthly and quarterly rhythm
Score each element from 1, not in place, to 5, best practice, on the Pricing Periodic Table scorecard, with a document or report to support any score of 4 or 5.
Frequently asked questions
Why do pricing improvements fade after implementation?
Seven reasons recur: no one owns the result after go-live, rules are worked around, overrides creep back unseen, incentives still pay on revenue, price files are not maintained, new starters are not trained and leaders stop asking.
How should a CFO measure the result of a pricing project?
Sign a baseline before any price moves and label every benefit annualised, a full-year run rate at stated volumes, or realised, what arrived in a stated period. Four measures are enough to start: price realisation against target, the list-to-pocket gap, override share and increase realisation, reported monthly.
What does a Pricing Council do?
It makes, records and reviews the pricing decisions that cross functions, meeting monthly during a rollout and at least quarterly after that, with a charter, named members and a standing agenda. Each decision is logged with its owner and a check date.
Where should a business start?
- CEO: Ask the CFO, Sales Director, Marketing Director and Pricing Manager to complete the Pricing Periodic Table scorecard separately, complete it yourself and set a date to compare the five sets of scores.
- CFO: Fix a 12-month baseline of customers, products, prices and volumes before the next price change, and label every result annualised or realised.
- CEO: Put the Pricing RASCI on the next leadership agenda and agree who is accountable for deal exceptions above authority limits.
- Pricing Manager: Set up the Pricing Council agenda and decision log, and publish the first monthly realisation report.
- Sales Director: Report every exception with its reason, and propose one realisation measure for the next sales incentive plan.
Related reading: Who Owns the Price, The Pricing Team and Pricing Training for B2B Sales Teams: What Changes Behaviour.
This paper is drawn from the book Pricing Insight: How to set, negotiate and hold your price, by Ron Wood.
To discuss how this applies to your business, contact Ron Wood.