
.webp)
A written pricing strategy states where a business will compete on price, where it will hold price and how it will grow margin. This Pricing Insight paper sets out the nine elements of that strategy and the 36-cube market model, which places every customer by how it sees the business, its size and its status.
A business with pricing rules but no written pricing strategy leaves each person to price from their own experience, match competitors by reflex and apply increases as if every customer held the same pricing power.
An Australian maker of medical consumables shows the alternative. Instead of a flat increase across every account, it grouped customers by pricing power and gave each group its own rate: about 4.5, 3.7 or 3.1 per cent. At the same 3.9 per cent average, placing the rise by pricing power was projected to earn about A$6.2 million against about A$5.9 million for a flat rise at the same 3.9 per cent average. It kept roughly 90 per cent of the most aggressive option's projected upside, and no weak account faced more than about 3.1 per cent. Separately, a national distributor repriced a block of unowned commodity lines and realised about A$1.6 million of margin, about 800 basis points on those lines.
Nine elements make up the method: a short written strategy, profit objectives, segment and channel strategy, online price transparency, pricing power, competitive response rules, a margin improvement program, consistent pricing policy and new product pricing. The 36-cube market model places every customer by how it sees the business, its size and its status, so margin and selling time can be compared segment by segment.
Four actions follow. Write the strategy, place every customer in a cube, set rules for matching a competitor and give the margin program one owner with dated targets.
What does pricing without a written strategy cost?
A written pricing strategy states where the business will compete on price, where it will hold price and how it will grow margin. Margin is the share of each sale left after the cost of the goods. An approval chart, a price book and a quoting routine are rules; none of them says what the rules are for. A panels salesperson wrote: "We don't have a pricing strategy that I'm aware of. Need a consistent approach to pricing. Very "ad hoc" at the moment."
The medical consumables maker was preparing its yearly increase across about 3,000 active products, most sold under supply contracts. Three options were under review: Conservative, At-market and Aggressive. Management leaned towards Aggressive, a single flat rise across every account, because it was simple, produced the largest number and treated every customer as able to absorb the same rise.
A fourth option, the Hybrid, grouped customers by pricing power. Strong groups took the Aggressive rate of about 4.5 per cent, moderate groups the At-market rate of about 3.7 per cent and weak groups the Conservative rate of about 3.1 per cent. Projected revenue was about A$6.2 million, against about A$7.1 million for the flat Aggressive option. The analysis put the dollar gap at about A$0.85 million, "not enormous in margin terms". The risk gap was far larger, because the Aggressive option moved every vulnerable account by the full rate in one step.
Shifting direction is the second cost. An Australian insulation manufacturer had plants with high fixed costs that needed throughput, and direction swung between volume and margin. It kept selling commercial building blanket at very low and negative margins to long-standing customers, because some had always been supplied and others were believed to be needed for volume. The diagnostic recommended a written strategy by product, channel and customer group, with regular analysis of which customers and products made money.
What people say
"Business flip-flops between chasing volume and chasing margin."
"Setting unrealistic/unlikely revenue targets forces sales people to chase that rather than the margin targets."
"It would appear that a lot of our competitors chase the market share and all too often we follow suit."
Profit objectives settle this trade in advance. They state when margin may be given up for volume, the minimum profit required and who approves. Sales targets are set in gross margin dollars as well as revenue, and every volume deal carries the arithmetic. On illustrative figures, a product selling for $100 at a 25 per cent gross margin earns $25 a unit. At 10 per cent off it earns $15, and the business must sell about 167 units instead of 100 to keep $2,500 of gross margin: about two-thirds more volume for the same gross margin dollars.
Four price-setting methods are available. Cost plus adds a fixed mark-up to cost. Matching follows competitors' prices. Mark to market sets price on purpose above, at or below a chosen competitor. Value pricing works out what the product is worth to the customer and sets price as a share of that. Use value pricing where the business differs from competitors and a market reference where it does not.
Where does pricing power sit? The 36-cube market model
Pricing power is the ability to hold or raise price without losing the business. It varies by customer and by product, so it is mapped customer by customer.
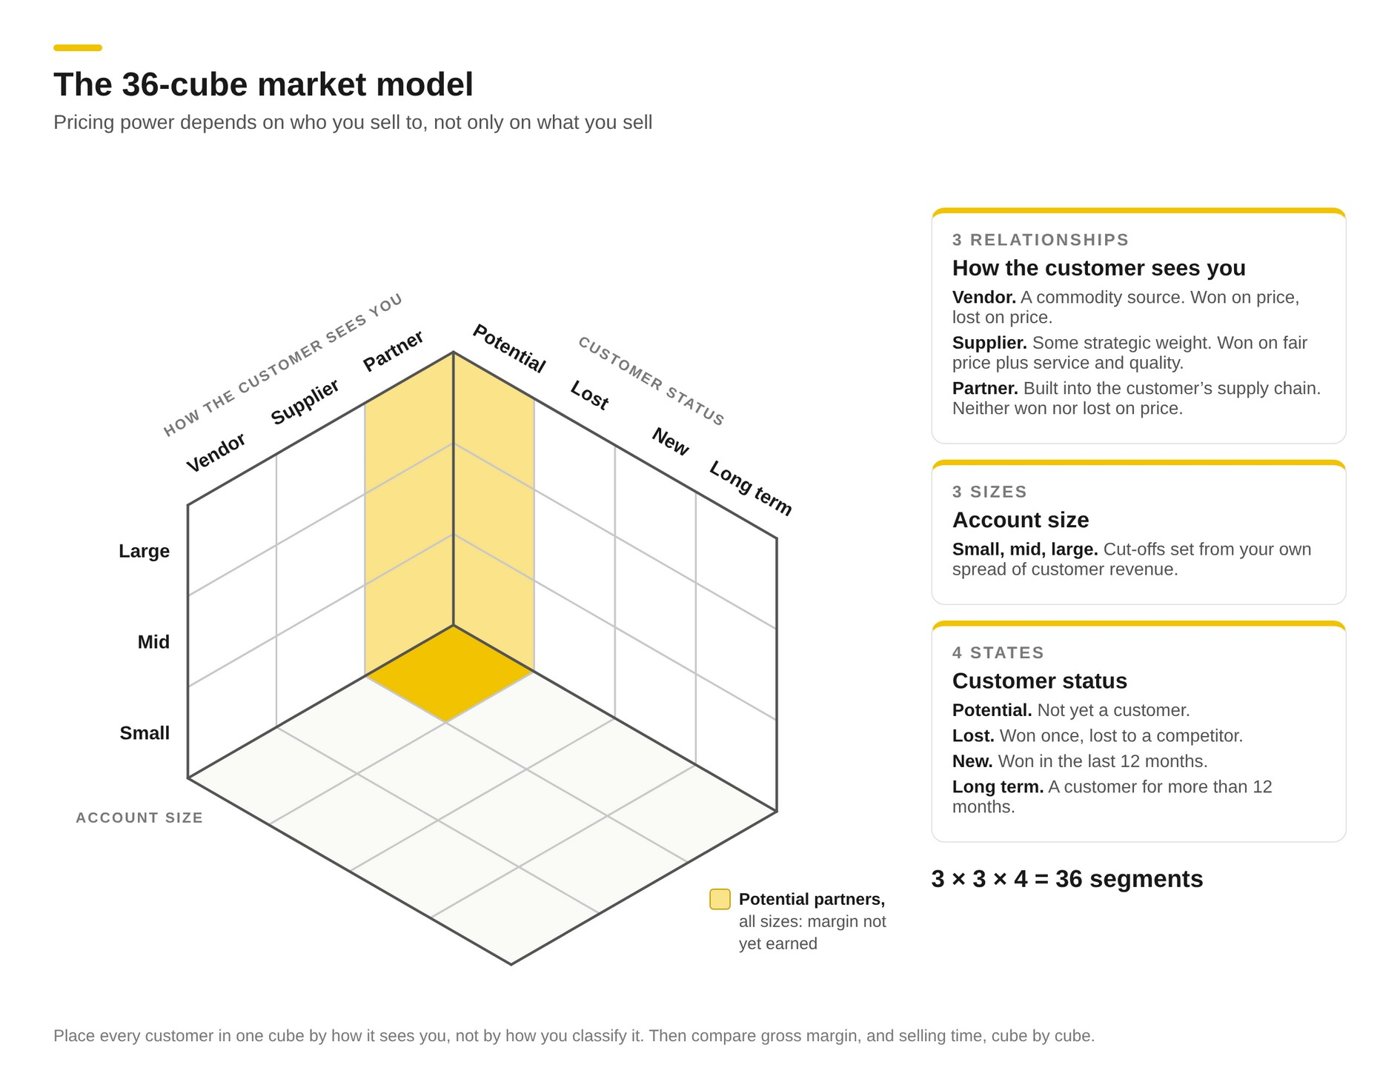
Figure 1. The 36-cube market model: pricing power depends on who you sell to, not only on what you sell.
Three dimensions sort customers in the 36-cube market model. The first is how the customer sees you. A vendor is a commodity source, won on price and lost on price. A supplier brings more than product, such as reports, technical help or some tailoring, and wins on a fair price plus a strong service and quality offer. A partner is built into the customer's supply chain, and both sides work to take cost out without cutting each other's margin. The second dimension is account size: small, mid or large, with cut-offs set from the spread of your own customer revenue. The third is status: potential, lost, new (won in the last 12 months) or long term.
Three relationships, three sizes and four states give 36 cubes. Place every customer and serious prospect in one, then work out the gross margin of each cube, and for potential customers estimate the margin the business could earn. In an illustrative map for a building products distributor, partner cubes earn 30 to 38 per cent gross margin and vendor cubes 12 to 19 per cent. In the same map selling time runs the other way, with small and mid-size vendor accounts taking up the week with requests for a lower price, while potential partners get what time is left. Four questions turn the map into a decision:
- How much gross margin sits in potential partner and supplier accounts?
- How much selling time went into winning them last year?
- How much time went on small and mid-size vendor accounts with low margin?
- What did that time cost in partner margin not won?
Set a strategy for each cube. How the customer sees you, and its status, set the strategy; size sets the tactics. Small accounts are priced from the list, mid-size accounts sit in banded tiers and large accounts are priced from their full economics with a walk-away set in advance. A new vendor customer is held at its entry price and moved to low-cost ordering. A potential partner is priced to value from the first proposal, on a multi-year agreement.
Within each cube, power still varies by account and product, and it can be measured. An Australian foodservice packaging supplier rated customers on switching cost, price awareness, relationship depth, growth and profitability. About 16 per cent of customers, holding about 12 per cent of net sales, fell in the lowest tier. Each tier received a different share of the recommended increase.
- Harvest: full share of the increase; goes first.
- Protect: standard share of the increase; value explained.
- Monitor: 75% of the increase; reviewed account by account.
- Risk: 50% of the increase; after investigation and a written value case.
A teaching framework lists nine parts of pricing power, in three groups, each moving from a low-power state to a high-power state.
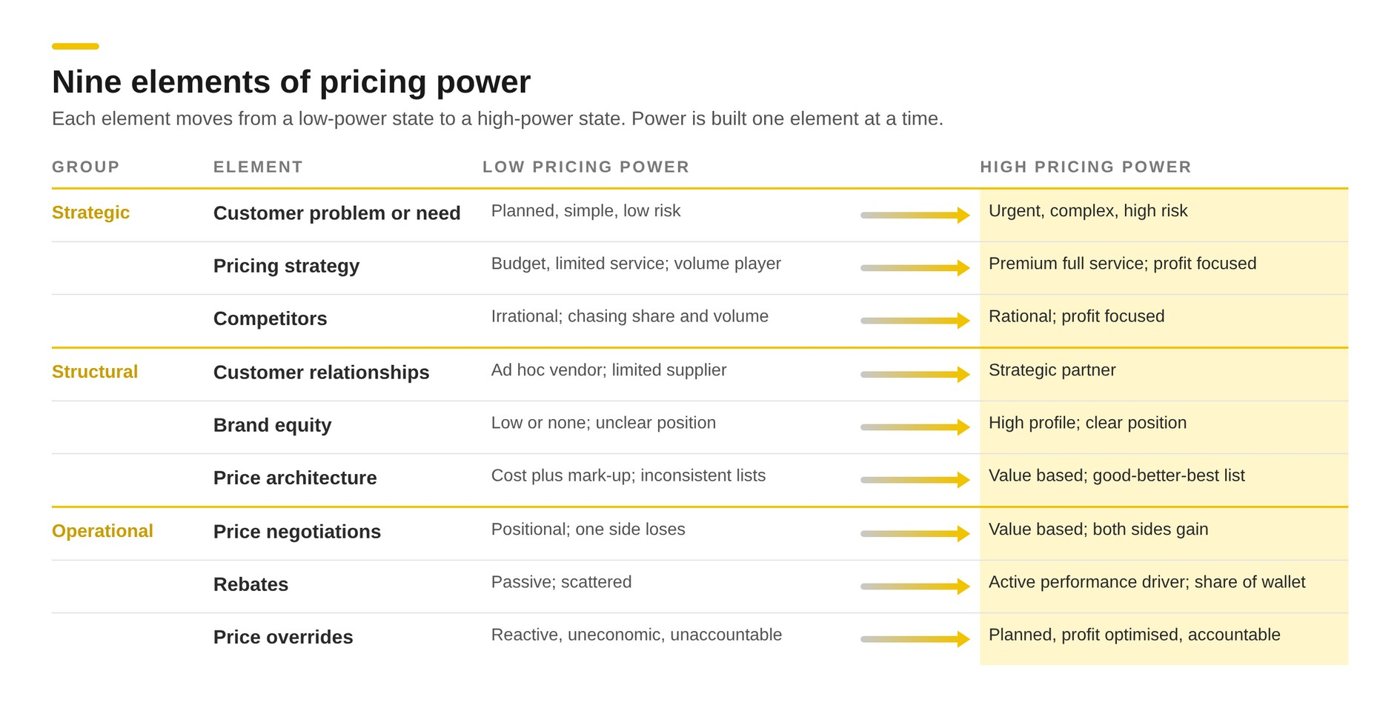
Figure 2. Nine elements of pricing power: each element moves from a low-power state to a high-power state.
Strategic elements come first: an urgent, complex, high-risk customer need, a premium full-service strategy and rational competitors who chase profit all give more room. Structural elements follow: being a strategic partner, a clear brand and a value-based price list. Operational elements come last: how you negotiate, whether rebates reward performance and whether overrides are planned.
Start the search where customers have the least information. Lines bought rarely, in small amounts or as part of a larger order are seldom price-checked. One construction salesperson judged that most customers "won't rebut margin creep of 0.5 - 1.0% as long as the service and quality of product remains the same." An Australian maker of decorative panels found the same in the field. Its reps dropped price whenever a customer claimed a competitor was cheaper, until one team held its price and staff reported that most customers accepted it. The reps concluded they had been selling too cheaply.
How should a business handle visible prices and competitor matches?
Online price transparency and marketplaces wearing down price positions was the eighth most raised gap across the diagnostic engagements behind this paper, and staff raised it in every one. Trade portals show each account its negotiated price beside a recommended retail price. Builders compare prices on their phones at the counter, and large customers load suppliers' account prices into their own systems. Prices that used to sit in a quote file are now visible.
Visibility differs by line. A construction salesperson described how builders "rank a supplier against a specific product like pine framing or formply", using it "as a measuring stick". Find the lines customers use this way before changing any online price.
Three fixes apply. First, a separate product strategy for online, with products, pack sizes and bundles chosen for each channel. Lines sold online are priced to the visible market, and lines sold with advice and delivery are priced to that value. Second, a service layer named on the quote, so the buyer sees what the online price does not include. Third, a rule with key resellers on advertised prices. This one needs care: in Australia and New Zealand a supplier that sets or enforces a reseller's minimum price can breach resale price maintenance law. Take legal advice before setting one.
Competitor response rules decide in advance when the business matches. A New Zealand rural supplies co-operative faced a rival that tendered below cost. Front-line staff matched, seed quotes went out at single-digit margins and some were still lost at about 3 per cent. A response grid by product category was recommended, with a match requiring a like-for-like product, within a set distance and time, and sight of a current invoice or quote.
- Match: only on key value items, with written evidence, never below the product floor.
- Trade: offer a different product, pack size or service level instead of a discount.
- Hold: the default; sell the value the business delivers.
- Walk away: the deal loses money after rebates and freight, or breaks a floor for nothing in return.
Log every request, granted or not, with the product, competitor, price claimed, evidence seen and result. Over a year the log shows which matches were needed to win and which were given away.
Why does margin need one owner and one policy everywhere?
A margin improvement program is a set of margin actions, each with an owner, a target and tracking, including a planned yearly price review. A national distributor's account team had stopped watching a block of commodity lines worth about A$20 million in revenue. With no owner, their prices drifted for several years. Repriced during a pricing project, they returned about A$1.6 million of margin, realised; the source does not state the period.
One director is answerable, reporting monthly. The program carries three to five actions, each with a named owner, a dollar target and a finish date. Results are tracked in the accounts, with realised gains and annualised run-rate reported separately against a starting point finance has agreed, and projections reported apart from both.
Pricing policy and consistency means the same product, for the same type of customer on the same terms, is priced the same way everywhere. A construction salesperson described one length of framing pine on which one branch needed a 16 per cent margin and another branch in the same state 32 per cent. The same builder could buy it from both, a day apart, and use the lower price as its reference with the other branch.
A teaching example puts a figure on the cost. One insulation product sold to small customers at anywhere from under $5 to $11 a square metre, while the largest customers paid about $6. Putting that one line on a consistent structure was modelled at about $178,000 in extra profit. Applied across half the business, the modelled gain was about $2.25 million a year. At a 5 per cent operating margin, that equals winning a new customer spending $45 million a year.
Some variation is justified by cost to serve or regional competition, within a set band and with a reason code for any price outside it. A short, fixed list is enough: competitor quote sighted, volume commitment, cost to serve, or a project price with an expiry date. To find where the policy is needed first, pull twelve months of invoices and compare the price paid for the same item, by the same type of customer, across branches and sellers. Align the discount approval chart across every branch, and report overrides by branch and seller each month.
New products need the same discipline before launch, when customers have no reference price. The Australian arm of a global office-technology company priced all its new managed IT services at a flat 40 per cent target margin. Its strategy manager said: "is a 40% Margin too high or too low? That's what we do not understand". A launch price review answers that question: no product launches until its price, price band, floor and channel prices, and the value case behind them, are approved against the customer's next-best alternative.
Which Pricing Periodic Table elements does this paper cover?
- 06 Ws Written pricing strategy: a short agreed document stating the price-setting method, price position, expected margin, decision rights and discount policy, reviewed on a fixed date each year.
- 07 Po Profit objectives: written rules for when margin may be traded for volume, the minimum profit and who approves; sales targets in gross margin dollars as well as revenue.
- 08 Sg Segment and channel strategy: three to five customer groups defined by need and cost to serve, and channel rules on price levels, project prices and exceptions.
- 09 Ot Online and price transparency: visible lines priced to the market reference, service lines priced to value, and one rule linking web, counter and account prices.
- 10 Pp Pricing power: customers and products rated for pricing power, with increases placed by tier rather than applied flat.
- 11 Cm Competitive response rules: a match, trade, hold or walk-away grid, sighted evidence before any match and a log of every request.
- 12 Mi Margin improvement program: one accountable director, three to five dated actions with dollar targets, and realised gains reported apart from projections.
- 13 Py Pricing policy and consistency: one approval chart for every branch, a set price band with reason codes, and overrides reported by branch and seller.
- 14 Np New product pricing: no launch until the price, floor and value case against the next-best alternative are approved.
Score each element from 1 (not in place) to 5 (measured, reviewed on a fixed date and improved); a score of 4 or 5 needs a document or report to back it.
Frequently asked questions
Should a price increase be the same for every customer?
Not where pricing power differs. An Australian maker of medical consumables gave strong, moderate and weak customer groups rises of about 4.5, 3.7 and 3.1 per cent; at the same 3.9 per cent average, this was projected to earn about A$6.2 million against about A$5.9 million for a flat rise at the same 3.9 per cent average, and no weak account faced more than about 3.1 per cent.
When should a business match a competitor's price?
Only on key value items, with written evidence, and never below the product floor. Holding price is the default; trading a different product, pack size or service level comes before a discount, and the business walks away where the deal loses money after rebates and freight.
What does inconsistent pricing across branches cost?
In a teaching example, putting one insulation product on a consistent structure was modelled at about $178,000 in extra profit, and about $2.25 million a year applied across half the business. At a 5 per cent operating margin, that equals winning a new customer spending $45 million a year.
Where should a business start?
- CEO: Ask two senior sellers, separately, where the business should sit on price against its main competitor. If the answers differ, commission a written pricing strategy and decide which customer groups and channels the business will protect.
- CFO: Set the rule for trading margin for volume and track gross margin dollars beside revenue each month, with realised gains reported separately from annualised run-rate.
- Sales Director: Pull the last ten price matches and count how many had a sighted competitor quote and something received in return. Apply the response grid from the next quarter.
- Marketing Director: Draft the price position and channel rules, including which lines are priced to the visible online market, and run the launch price review for every new product.
- Pricing Manager: Place every active customer in the 36 cubes and report gross margin by cube. List the three product groups nobody has repriced in the past year and name an owner for each.
Related reading: What Customers Pay For, Price Increases That Stick and Holding Price in the Field.
This paper is drawn from the book Pricing Insight: How to set, negotiate and hold your price, by Ron Wood.
To discuss how this applies to your business, contact Ron Wood.