
.webp)
A business prices on evidence when it runs five routines: a competitor price record, a win/loss record with fixed reason codes, a model of each significant decision, a price-position review led by the key value items, and like-for-like realisation measures. Pricing Insight groups them in two: two record the market and three test the business's own prices.
An Australian trade distributor of cabinet and architectural hardware listed a pull-out waste bin on its website at about A$509. Competitors listed the same kind of bin at about A$175 to A$190. The business had no record of market prices, and the gap went unseen until sales people lost business and said so.
The cost runs in both directions: price cuts approved on competitor claims nobody has seen, and prices above the market where customers compare most. Inside the business, revenue and margin can rise while prices slip. An Australian and New Zealand supplier of foodservice packaging grew gross profit by more than A$11 million in a year. Over the same period unit cost fell about 8 per cent and unit price about 1 per cent, so the whole gain came from cost, not price.
Five routines supply the evidence. Two record the market: a competitor price record and a win/loss record with fixed reason codes. Three test the business's own prices: a model of each significant decision, a price-position review led by the key value items, and like-for-like realisation measures.
Approve no price match without a sighted quote or invoice. Close every significant quote with a reason code. Check the key value items against the market every month. Report price realisation beside revenue and margin, on a fixed set of customers and products.
What happens when prices are set without evidence?
Account customers paid well below the A$509 website price, but a cabinet maker looking for a bin did not start by calling an account manager. They compared two websites and bought from the cheaper one. As the sales team put it, "Customers compare us to [competitor] side-by-side and don't even call." Reps found that the inflated price hurt trust across the whole range.
No routine compared the business's published prices with what competitors showed online. Sales picked out the 45 items customers compare most often and recommended correcting those prices within the week, with the walk-up trade price becoming the single published price, online and at the counter; the correction has not yet been measured.
One decorative-surfaces maker now trades more than half its revenue through digital channels. Plumbing distributors run trade portals that show each plumber's negotiated price next to the recommended retail price, so a wrong price is visible to the customer as soon as it is loaded.
Two kinds of evidence. From outside the business: competitor prices, the reasons deals are won and lost, and where each product sits against the market. From inside: what a change will do to profit, and whether the prices set are the prices received.
How should competitor prices and wins and losses be recorded?
A customer says a rival is cheaper, the rep matches, and the discount becomes that customer's price from then on, often with no competitor price ever sighted. Across 30 years of work with hundreds of companies and thousands of executives in more than 15 countries, the closing discount is the pricing issue sales staff raise most often.
At an Australian plumbing supplies distributor, branch staff dropped prices on hot water units, PVC fittings and copper whenever a customer said a rival was cheaper, without asking to see the quote. Competitor prices sent to the pricing team went nowhere anyone could see, so each branch built its own picture of the market. Its review recommended an invoice or quote before any match, a fortnightly index of the lines customers compare, and a grid showing when to match, offer another product or walk away. No result is stated.
A market price record is one owned file of competitor, online and import prices. Each entry needs six fields to be usable.
Checklist
- The product and the competitor's equivalent, noting where it is not a true match.
- The competitor and the channel: trade, retail, online or import.
- The net price, quantity, freight and payment terms.
- The date seen; anything older than 90 days is out of date.
- The evidence: a quote, invoice, screenshot or catalogue page.
- The customer who raised it, and what the business did.
Two rules give the record its value. No price match is approved unless all six fields are complete, and the items customers compare most are checked on a fixed cycle whether or not anyone has complained. The Pricing Manager owns the record, sales people supply it, and a monthly report back to sales shows which prices changed because of what they found.
Won and lost sales are the other half of the market picture. The common faults: quotes stay open after the job has gone elsewhere, reason codes are optional, and losses caused by stock-outs or slow delivery are never captured. Without records, the deal lost on price is the one retold, and discounts widen across a whole customer group to guard against losses that may have had other causes.
On every tender at a national surveying consultancy, principals adjusted price-book rates to what they thought would win, weighing the other bidders, the client relationship, current workload and the last job. The firm kept no record of past wins and losses to test those judgements, including tenders won well below the next bidder.
A win/loss record needs a short, fixed list of reason codes and a rule that one is entered before any significant quote is closed. Each code below shows when to use it and who fixes the cause.
- Price: evidence sighted: a lower competitor quote or invoice was seen. Fixed by the Pricing Manager.
- Price: claimed only: the customer said price, with no evidence. Fixed by the Sales Director.
- Stock or availability: the item was not available when needed. Fixed by the supply team.
- Lead time: delivery could not meet the customer's date. Fixed by the supply team.
- Service or support: the customer chose on service or past problems. Fixed by the Sales Director.
- Range or specification: the business had no suitable product. Fixed by the Marketing Director.
Splitting "evidence sighted" from "claimed only" separates buyers who are price-led from those using price as a tactic. Every sighted price also becomes an entry in the market price record. Review win rates each month by customer group, product and price band, and take a sample of won deals to ask whether the price could have been higher.
What people say
"We will drop our price on customers feedback without actually seeing the evidence."
"This price list has been developed against a competitor's price list from 2 years ago, we could be missing out on margin as they may have increased their pricing since then."
"Centralized data base to track our competitors pricing would be beneficial. Nothing in place at the moment. Which means often we're pricing blind."
How is a pricing decision modelled before it is made?
Price modelling shows the effect of a pricing decision on profit before it is made. Without it, a discount is judged on the margin rate of the deal in front of the rep, not on the margin dollars the business keeps, and increases are set as one figure for everyone because no one can show the effect by segment. One staff member wrote that modelling "tends only to be done for a few larger tenders", and asked for "a simple easily understood tool that anyone can use."
A 3 per cent move each way shows the difference.
The numbers: illustrative figures
- A product sells for $100 at a 30 per cent gross margin; 100 units earn $3,000.
- A 3 per cent increase lifts the unit margin to $33.
- The business could lose 9 units in 100 and still earn about $3,000 (91 × $33 = $3,003).
- A 3 per cent discount instead cuts the unit margin to $27.
- To earn the same $3,000, it must sell about 111 units: 11 per cent more volume.
In a teaching case from insulation, the average price rose from $4.85 to $5.00 a square metre, a rise of 3.1 per cent. With volume held, operating profit went from $75,000 to about $184,000. The model also showed that volume could fall 4.8 per cent before profit dropped back to the old level.
A medical consumables maker modelled four increase scenarios, and its executives asked what sat behind each recommended rate, so one cell was traced line by line in the live workbook. An extra-large sterile surgical gown scored 0.55 on product pricing power, which mapped to a base increase of about 3.0 per cent. A strong private hospital customer applied a 1.3 multiplier, giving about 3.9 per cent, and weighting across the hospitals that bought the gown brought it to about 3.25 per cent. Calibrating to the 3.7 per cent target gave a final rate of 3.3 per cent, with every weight left editable for the executives to test.
Good modelling draws current costs, rebates and prices from the business system, can be used by more than one or two people, and goes with every significant decision. Start with a break-even calculator, given to everyone who can approve a discount. Above a set deal size, attach a margin-dollar model before approval.
What are key value items, and how is price position checked?
A timber seller explained: "Customers often rank a supplier against a specific product like pine framing or formply. This may not be their biggest purchased item, but they know the pricing on these products and will use as a measuring stick." These are the key value items: lines customers buy often, know well and use to judge the rest of the list. One priced above the market makes the whole list look dear, as the A$509 bin did; one priced at the market leaves room on lines customers check less.
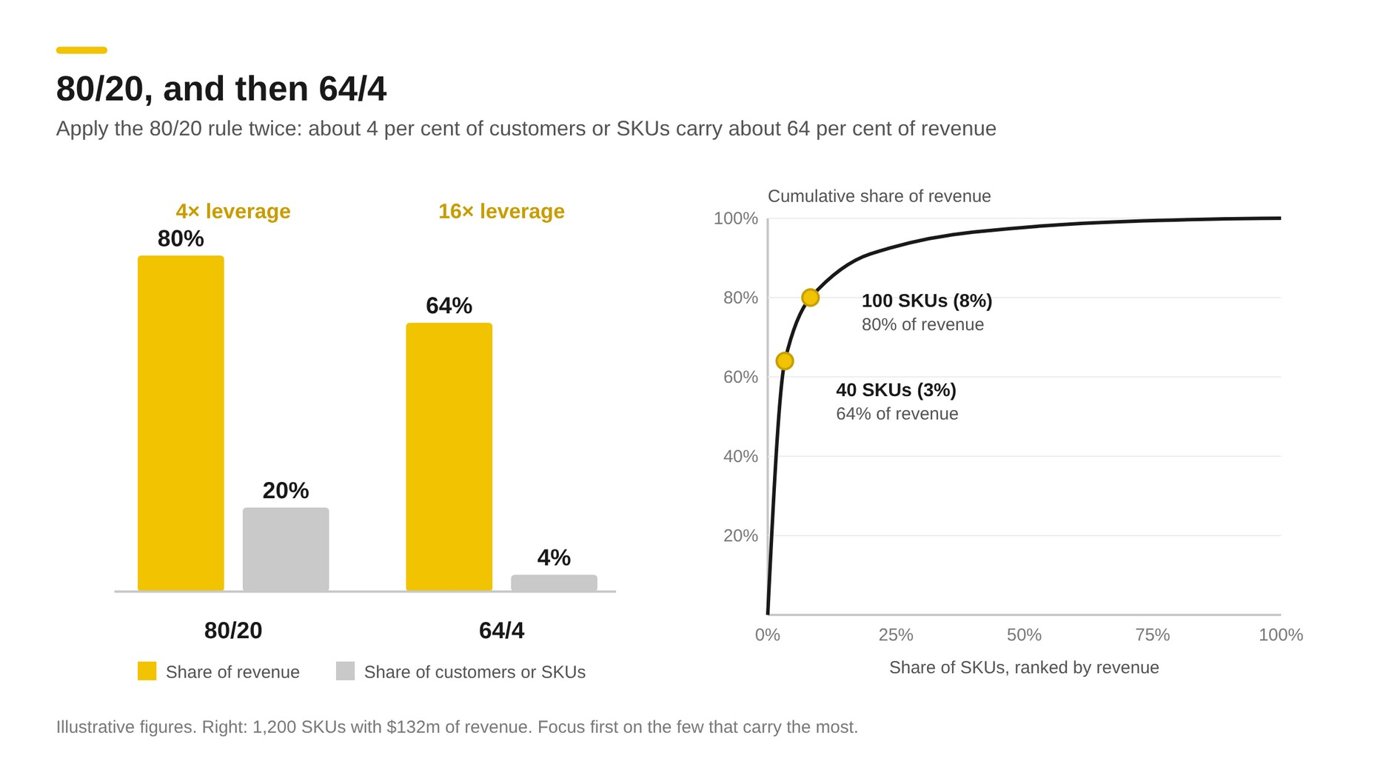
Figure 1. 80/20, and then 64/4: apply the 80/20 rule twice, and about 4 per cent of customers or SKUs carry about 64 per cent of revenue.
An 80/20 analysis finds most of the candidates. In many businesses about 20 per cent of products earn about 80 per cent of revenue. If the pattern repeats within that group, about 4 per cent earn about 64 per cent. In the teaching example in the figure, 1,200 products earned $132 million. Forty of them, about 3 per cent, earned 64 per cent of revenue, and 100 earned 80 per cent, so checking those 40 each month covers most of what customers see. Add the lines sales staff hear quoted back to them and the lines that appear most often in competitor claims. Price each key value item against the visible market reference, check it against competitor prices every month, and fence it against further discount.
Every other line needs a line-by-line review, because lines priced too low and too high offset each other and the total margin looks fine. A national distributor won back about 800 basis points of margin, realised, by repricing commodity lines that had not been reviewed, using data already in its system.
At a New Zealand building-supplies retailer with a trade arm, an account manager found that a house-build quote needed about 13 to 15 per cent gross profit to compete, while the system price gave about 22 per cent. The review recommended regional rates for key lines and a record of rival trade prices, with no result yet reported.
Five steps, in this order.
- Report every price below cost or below the standard floor.
- Compare the key value items, then the other top lines by revenue, with current competitor prices, and mark each as under, at or above the market.
- Place each line on a revenue and margin grid, using Customer Value Discovery scores where its value is disputed.
- Set an expiry date on every special and project price, and remove those with no recent sales.
- Feed the findings into the next price increase, so it has a target list rather than one figure for everyone.
A line where the customer rates importance high and scores the business well above the competitor, on value in use or value at risk, can carry a price above the market. A line that scores at parity is priced against the market reference.
How is the price received measured?
At the foodservice packaging supplier, management took a gross profit rise of more than A$11 million as proof that pricing was working. On the same customers and products, the cost saving was worth about A$12 million, so without it gross profit would have fallen, and no one owned or measured whether price rises held. Its review projected an exposure of about A$12 million a year if the saving went to customers in the next price round. If costs rose with producer prices and prices did not follow, the projected loss was about A$6 million a year.
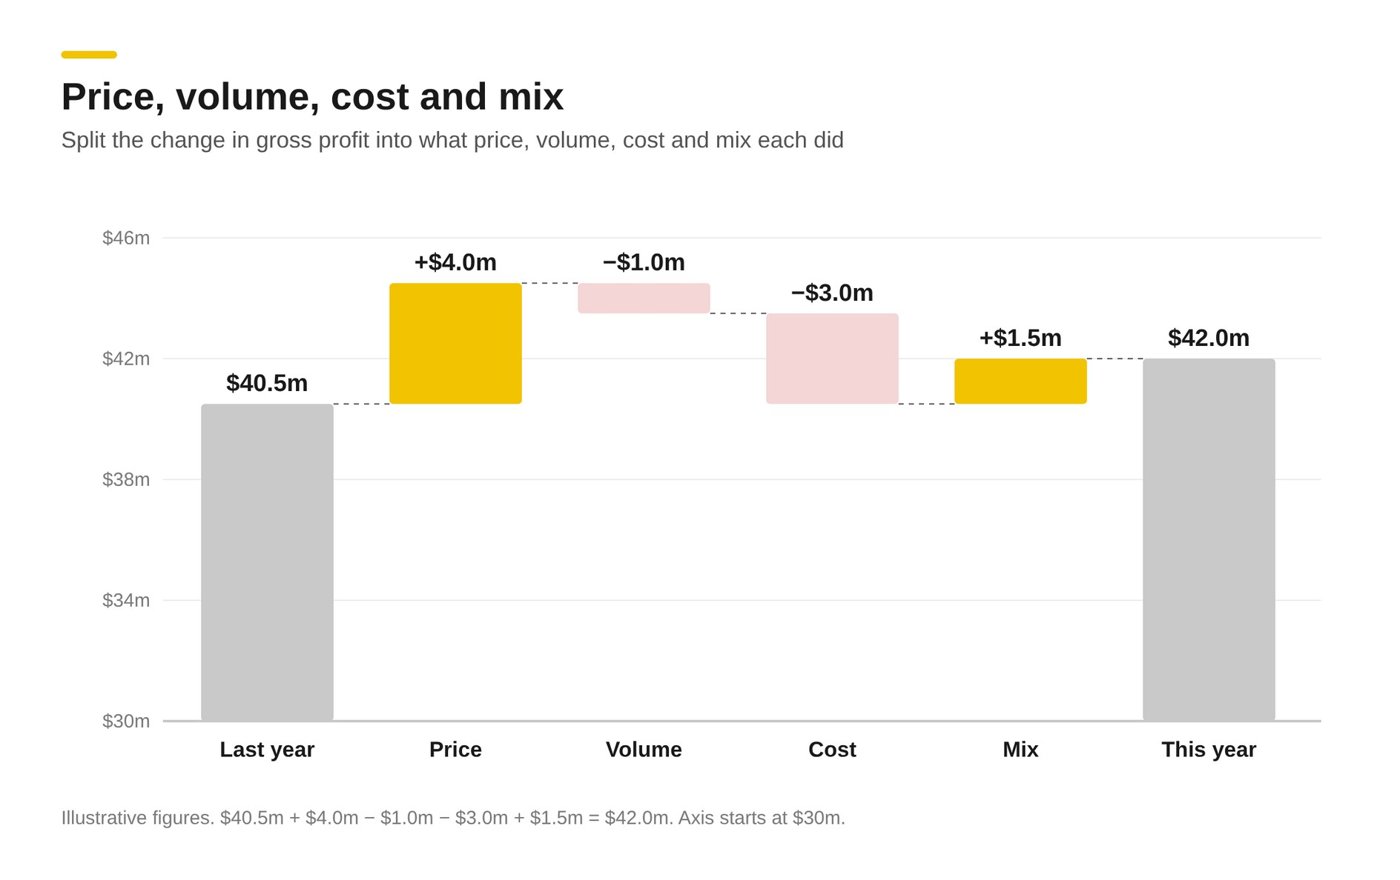
Figure 2. Price, volume, cost and mix: split the change in gross profit into what price, volume, cost and mix each did.
A price, volume, cost and mix bridge separates these effects. It starts with last year's gross profit, adds or subtracts the effect of each cause one bar at a time, and ends at this year's. In the teaching example in the figure, gross profit rose from $40.5 million to $42 million. Price added $4 million and better mix $1.5 million, while lower volume took away $1 million and higher costs $3 million. A cheaper buy price and a higher sell price are separate bars, so no gain is counted twice.
Two building-products makers realised only about 80 per cent of each planned increase, with no decision recorded to give the rest away. An Australian plastic pipe maker kept two base prices, one for merchants and one for everyone else. Increases reached customers without trading agreements but not merchants with them, and the two lists drifted apart unseen because increases were not measured by customer group.
Four measures, each with its definition and how it is reported.
- Price realisation: pocket price achieved divided by target price. Reported monthly, by customer, product and rep.
- List-to-pocket gap: list price less pocket price, in dollars and basis points of revenue. Reported monthly, by step from list to pocket price.
- Override share: revenue sold through overrides and exceptions, as a share of all revenue. Reported monthly, by rep and customer.
- Increase realisation: increase achieved divided by increase planned. Reported monthly for six months after each rise.
Pocket price is the money the business keeps from a sale after every discount, rebate and allowance. In an illustrative case, a planned 5 per cent increase on $20 million of revenue delivers 4 per cent: 80 per cent realisation, where the missing point is worth $200,000 a year of operating profit. Define each measure once and reconcile it to reported revenue and gross margin. Put every variance outside target on the Pricing Council agenda with an owner and a date. Measure on a fixed set of customers and products, so volume, mix and new lines do not flatter the result.
Which Pricing Periodic Table elements does this paper cover?
- 41 Ci Market price intelligence: one owned record of competitor, online and import prices, with no match approved without sighted evidence.
- 42 Wl Win/loss analysis: every significant quote closed with a reason code that separates sighted prices from claimed ones, reviewed monthly.
- 46 Pm Price modelling: every significant discount, deal and increase arrives with its margin-dollar model and break-even volume.
- 47 Ps Price position and key value items: key value items checked against the market every month, and the full range reviewed line by line on a set cycle.
- 48 Kp Price realisation KPIs: price and increase realisation reported like for like, reconciled to the accounts, beside revenue and margin.
Score each element from 1 to 5, where 1 means it is absent, with no owner and nothing written down, and 5 means it is in place, used every week and measured.
Frequently asked questions
What is price realisation?
Price realisation is the pocket price achieved divided by the target price, where pocket price is the money the business keeps after every discount, rebate and allowance. Report it monthly by customer, product and rep, on a fixed set of customers and products, beside revenue and margin.
Can gross profit rise while prices are slipping?
Yes. A foodservice packaging supplier grew gross profit by more than A$11 million in a year while unit price fell about 1 per cent; the whole gain came from an 8 per cent fall in unit cost. A price, volume, cost and mix bridge separates these effects.
What are key value items in pricing?
Key value items are the lines customers buy often, know well and use to judge the rest of the list. One priced above the market makes the whole list look dear, so check each against competitor prices every month and fence it against further discount.
Where should a business start?
- Pricing Manager: List the 20 items customers compare most and check each against current competitor and online prices this week.
- Sales Director: Pull the last ten significant quotes lost and record for each whether a competitor price was ever sighted. Require a sighted quote or invoice before any future match.
- CFO: Measure how much of the last price increase held on a like-for-like set of the 20 largest customers, and build a price, volume, cost and mix bridge for the last year.
- Marketing Director: Own the list of key value items and decide which lines move at the next increase, using Customer Value Discovery scores where value is disputed.
- CEO: Decide whether to lead, match or sit above the market in each major category, and make price realisation a standing line in management reports.
Related reading: Holding Price in the Field, The Price You Actually Keep and Price Increases That Stick.
This paper is drawn from the book Pricing Insight: How to set, negotiate and hold your price, by Ron Wood.
To discuss how this applies to your business, contact Ron Wood.