

Case study · Wholesale and distribution · Office products · 7 min read
Source: Figures in this case study are reported by Pricing Insight. Background documents: pricing strategy report for Corporate Express Australia, 2 September 2008; Project Treasure project initiation document, November 2008; post-implementation analysis, 25 March 2009; pre and post tracking data, May 2009; pricing guidelines and toolsets manual, April and December 2009; proposals, June and July 2009.
Sixty price lists and a cost-plus habit. In 2008 Corporate Express Australia, the office products distributor that later traded as Staples, was an ASX-listed business with about A$1.3b of revenue, part of the Staples group, and under margin and earnings pressure. It held about 70% of the national account segment, competitors were buying share with low bids, and it was about to move its pricing onto SAP. Pricing Insight's diagnostic found prices set by a cost-plus rule of thumb, around 60 price lists, discounts by SKU for each customer, decentralised price authority and significant unaccounted price overrides, and set out a national price structure in their place. The first repriced lines went live in March 2009, and Pricing Insight then helped build the business's new central pricing team, its pricing manual and its bid strategy. The result was A$6.8m of EBITDA realised within 12 months of implementation.
| Client | Corporate Express Australia, a member of the Staples group, which later traded as Staples Australia. Office products, business furniture, IT, facility supplies, catering, print and promotional products for business, government and education customers. |
| Service | Pricing strategy diagnostic, August and September 2008, then Project Treasure pricing implementation: quick wins, national list price design, SAP pricing design input, sales workshops and pricing team training, October 2008 to December 2009. |
| Status | Realised. A$6.8m EBITDA improvement within 12 months of implementation. |
| Scope | Office products and the catalogue channel first, with categories across paper, coffee and catering, filing, writing instruments and computer consumables; the pricing team, sales and key account managers. |
| Period | Strategy report 2 September 2008. Implementation plan November 2008. First repriced lines live March 2009. Post-implementation analysis 25 March 2009. Pricing manual version 2 December 2009. |
The brief
Replace cost-plus pricing and dozens of price lists with a national price structure and a central pricing team, in time for the move to SAP, and prove the margin on live sales before rolling it out.
01A market leader pricing by mark-up
Large, profitable and leaking margin. Corporate Express Australia reported revenue of A$648m for the half to June 2008, with an EBIT margin of about 8%, and projected about A$111m of EBIT for the year. Its project plan put the problem plainly: the business was under significant margin and earnings pressure. In the national account segment, where it held about 70% of the market, two competitors were attacking with low bids, and the business was about to replace its ERP with SAP, which it had flagged as a risk to its pricing.
The pricing it would carry into SAP had grown by accretion. Account teams set quotes at cost plus a mark-up, often 25%. The business ran around 60 individual price lists, discounted SKU by SKU for each customer, and priced contracts line by line, some below cost. Price authority sat with individuals in each state, procurement and sales each adjusted costs and prices, and price overrides went largely unaccounted for.
Some prices made the problem visible. Rubber bands sold at A$14 a kilogram where a retail competitor charged A$33. A trolley was priced at A$117.12. The diagnostic described a "red rag" effect: one minor product priced so far out of line that it damaged the credibility of the whole offer with the customer.
02What the diagnostic found, and what it was worth
Three areas, ten recommendations. The strategy report of 2 September 2008 analysed A$594m of sales for the six months to June 2008, alongside diagnostic interviews, workshops and benchmarking. It set three areas of focus: centralise price leadership, build one national price list, and set national standards for contracts and bids.
Cost plus used as a proxy for value.
A mark-up rule across every line of business, inconsistent gaps between private label and branded products, and price points that undermined trust in the rest of the list.
Too many price lists.
Around 60 price lists and SKU-level discounts by customer, which had created problems of price integrity and credibility across the market.
Price authority with individuals.
Decentralised authority, state-based workarounds, duplicated roles between sales, procurement and pricing, and pricing knowledge held by individual staff.
Contracts priced line by line.
Bids built item by item at system cost plus a margin, with no national contract method, no standard modelling tools and low share of wallet beyond office products.
Overrides and intelligence.
Significant unaccounted price override activity and no structured program for competitor price or value intelligence.
A central pricing team with a clear mandate, and one national list price set on value, in place of 60 lists built on cost plus.
In November 2008 the implementation plan took the three areas to the board against projected EBIT of about A$111m, with the catalogue and office products lines to be repriced first. The result was A$6.8m of EBITDA within 12 months.
03What Pricing Insight did
Prove it on live sales, then build the function. The implementation phase, Project Treasure, ran from October 2008, with the business's own analysts pricing a share of the SKUs alongside Pricing Insight.
Designed pricing into SAP.
Workshops in October and November 2008 on base prices and mark-ups, list less discount and promotions, so the new system priced from a national list with discounts at the highest product level.
Repriced the first lines and measured them.
Quick-wins analysis across office products, catering and janitorial lines from November 2008, with the first optimised prices live in March 2009 and pre and post tracking of every SKU.
Built the pricing manual.
The pricing guidelines and toolsets manual: a category price review model, relativity tables, price points, private label rules, contract modelling, competitor basket analysis and rebate menus, revised in December 2009.
Trained sales and the pricing team.
Sales pricing workshops in March and April 2009, rebate and capability workshops in May, and an introduction of the new central pricing team to the sales force in July.
Wrote the bid and tender strategy.
A contract and bid pricing strategy in August 2009 for a segment where competitors were pricing low to win share, moving negotiation from line items to the whole contract.
Move from about 60 price lists set by mark-up to one national structure, priced on value and run by a central team.
04What changed: A$6.8m of EBITDA realised within 12 months
A$6.8m of EBITDA within 12 months. The national price structure, the repriced categories and the central pricing team delivered an EBITDA improvement of A$6.8m within 12 months of implementation.
First came a test on live sales. Pricing Insight compared the first 15 days of tracked sales on the first repriced lines with the 15 days before. Gross profit on those lines rose from about A$487,000 to about A$613,000. Price contributed A$143,000, partly offset by A$28,000 of higher cost of goods, with volume and mix effects close to nil.
- Sales on the tracked lines rose 10.7% and volume 1.4%, so the gain came from price rather than lost customers.
- The price effect of 8.2% ran ahead of the 6.3% the plan had estimated, with most categories in line with their estimates.
- All but two categories grew sales. In hot beverages gross profit rose 54% while volume rose 3%, as buyers moved towards premium coffee and tea.
- Within weeks, a leading competitor raised its own prices on two of the same key lines.
Further waves followed: 900 more SKUs from April 2009, toner repositioned against branded products, a further 2,000 SKUs, and the new structure rolled out to the other business units. By June 2009 the business had a central pricing team with a head of pricing, strategic pricing analysts and a pricing lead for each customer segment, and the quick wins program was continuing. The program delivered A$6.8m of EBITDA within 12 months.
Status: realised. The A$6.8m is the EBITDA improvement reported by Pricing Insight, within 12 months of implementation. Fees are not disclosed.
05The Pricing Periodic Table elements this work built
Eight elements built, seven still open. The Pricing Periodic Table maps 61 elements of pricing capability in nine domains across three pillars: Value, People and Structures. The work started with a written strategy and the people to run it, then proved the method on live prices.
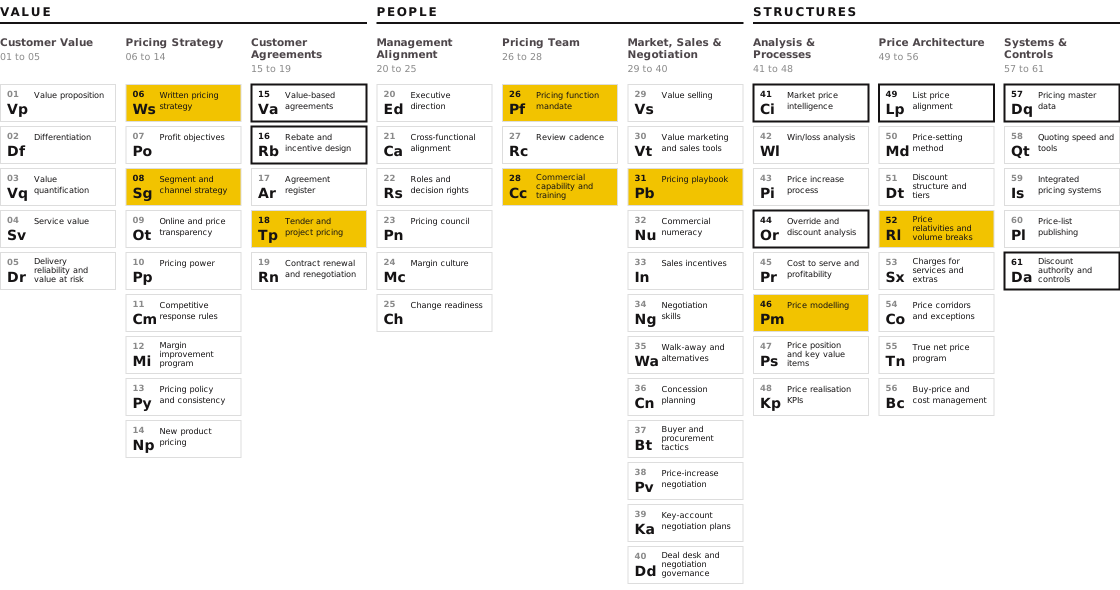
06 Ws, Written pricing strategy: the September 2008 report. 26 Pf, Pricing function mandate and 28 Cc, Commercial capability and training: the central pricing team and the sales and pricing workshops. 31 Pb, Pricing playbook and 46 Pm, Price modelling: the pricing manual and its category price review and contract models. 52 Rl, Price relativities and volume breaks: the repriced lines, private label relativities and price points. 08 Sg, Segment and channel strategy and 18 Tp, Tender and project pricing: pricing by customer segment and the bid and tender strategy. The outlined elements were still in progress: the national list price across all units (49 Lp), value-based agreements (15 Va) and rebates (16 Rb), competitor price intelligence (41 Ci), override analysis and discount authority (44 Or, 61 Da) and pricing master data (57 Dq).
06Three lessons for a CEO
Fix pricing before the system migration
Sixty price lists loaded into SAP would have become sixty price lists in SAP. Designing the national list and discount logic into the new system was cheaper than retrofitting it.
Prove the margin on live sales
A 15-day pre and post comparison on the first repriced lines showed gross profit up 26% with volume intact. That evidence, not the diagnostic estimate, is what earns the rollout.
Centralise authority, not just analysis
Cost plus survives where every account manager can set price. A central team with a mandate, a manual and segment pricing leads changes who decides, which is what changes the margin.
The methods used here are the basis of Project Blackbird price optimisation and the Strategic EBIT Opportunity & Risk Diagnostic.
07Questions this case study answers
Who can help a company set up a dedicated pricing team or pricing manager function?
At Corporate Express Australia the diagnostic recommended a central pricing team with a clear mandate and no dotted lines to sales. By mid-2009 the business had a head of pricing, strategic pricing analysts and a pricing lead for each customer segment, trained by Pricing Insight and working from a pricing manual with category review, contract and rebate models. Pricing Insight designs the mandate and roles, and trains the team.
How do I stop sales reps over-discounting in a B2B business?
Take price setting away from the mark-up rule and the individual. Corporate Express had around 60 price lists, SKU-level discounts by customer and unaccounted overrides. The fix was one national list price set on value, discounts at the highest product level in SAP, a central team holding authority, and a bid method that negotiates the whole contract rather than each line. The program delivered A$6.8m of EBITDA within 12 months of implementation.
We have inconsistent customer discounts across branches. Who can help us rationalise them?
Pricing Insight's diagnostic at Corporate Express found state-based workarounds and discounts set SKU by SKU for each customer. The business moved to a national list less discount structure designed into its SAP rollout, repriced its first lines in March 2009 and realised A$6.8m of EBITDA within 12 months of implementation.
Related case studies · Wholesale and distribution
Start with the diagnostic
The first conversation covers how many price lists your business really runs, who can change a price, and what repricing your first categories would be worth at your volumes. Ron Wood, +61 410 534 099.
Ron Wood is the Founder and Managing Director of Pricing Insight, an Australian pricing strategy consultancy he established in 2007. He has worked in pricing for around 30 years, first as a pricing and commercial manager in consumer goods, building materials and capital equipment, and since then across more than 160 pricing engagements. He also founded Pricing University, which has trained more than 5,000 executives.
To discuss a pricing diagnostic or Project Blackbird, contact Ron Wood at info@pricinginsight.com.au or on +61 410 534 099, or visit Pricing Insight.
Figures in this case study are reported by Pricing Insight. Background documents are Pricing Insight's pricing strategy report for Corporate Express Australia (2 September 2008), the Project Treasure implementation plan (November 2008), the post-implementation analysis (25 March 2009), pre and post tracking data (May 2009), the pricing guidelines and toolsets manual (2009) and Pricing Insight proposals (June and July 2009). Company results are from the Corporate Express Australia half-year results for June 2008. The gross profit figures for the first repriced lines cover the first 15 days of tracked sales.