


White paper · Transform · 21 min read
Sources: Pricing Insight diagnostic and workshop material, case studies and the Pricing Periodic Table, CXO Edition. The A$1.9 million figure is projected, from a negotiation program that had not been measured at the time of writing. The three-fifths figure is illustrative arithmetic. No figure here is a benchmark for another business.
Most of the margin a B2B business gives away in negotiation goes before the meeting starts or after it ends. In our diagnostic work the same twelve issues recur, whatever the industry: four in preparation, four in the room, three in what happens to the price after the deal, and one in the structure around the seller. Each has a known fix, and most of the fixes are preparation, structure and governance, with technique a smaller part.
The question this paper answers
Where does a B2B business lose margin in negotiation, and what is the opportunity in each place?
Negotiation is usually treated as a sales skill: something that happens in a meeting between a seller and a buyer. The diagnostic evidence points somewhere broader. A seller who cannot see the rebate behind a customer's price discounts again. A seller with no written walk-away concedes past it. A price increase agreed in a meeting is worn away by one-off cuts in the weeks after. A special price given for one project is reused on the next. None of these is a failure of technique at the table, and all of them show up in the margin line.
This paper sets out the twelve issues, what each costs and the opportunity in each, drawing on Pricing Insight's diagnostic method, the Customer Value Discovery program, the negotiation workshop and the Pricing Periodic Table. Two companion papers cover the skills and the training in more depth: Sales Negotiation Skills for B2B Sellers and Negotiation Training for Sales Teams.
01Twelve issues in four places
Four places, twelve issues. The table lists each one with the opportunity it holds and the Pricing Periodic Table elements that address it. The sections that follow take them in order.
| Where | Issue | Opportunity | Elements |
|---|---|---|---|
| Before the meeting | 1. Sellers cannot cost a concession | A margin walk and the break-even rule at the point of quote | 32 Nu |
| 2. No walk-away, or one built on product cost | Three written positions, built from the full cost to serve and approved | 35 Wa, 39 Ka | |
| 3. Value is described and never measured | A value case in the customer's dollars, three to five times the price gap | 03 Vq, 29 Vs, 30 Vt | |
| 4. Pricing power goes unused | Accounts placed by pricing power, with services such as urgent delivery charged for | 10 Pp | |
| In the room | 5. Procurement is trained and sellers are not | A written response to each tactic, rehearsed | 37 Bt, 28 Cc |
| 6. The rival quote is taken on the buyer's word | Proof before price, then hold, trade, match or walk under written rules | 34 Ng, 11 Cm | |
| 7. Concessions are given, early and in equal steps | A give-get list priced by Finance, with price last and steps that shrink | 36 Cn | |
| 8. The negotiation runs with the wrong person on the wrong price | The value case taken to the economic buyer, on four prices | 05 Dr, 39 Ka | |
| After the deal | 9. Price increases are given back | Increases sized by account, run as a sequence and checked on the invoice | 38 Pv |
| 10. Rebates are paid on turnover and unseen at the quote | Rebates paid for growth, capped and visible to the people who quote | 16 Rb, 15 Va | |
| 11. Special prices never expire | A reason, an owner and an end date on every special price, and renewals planned from expiry | 19 Rn, 18 Tp | |
| Around the seller | 12. No authority, no record and the wrong measure | A discount authority matrix, a deal desk and measures of what is given away | 40 Dd, 61 Da, 42 Wl, 44 Or |
Exhibit 1. Twelve negotiation issues, the opportunity in each and the Pricing Periodic Table elements that address them. Source: Pricing Insight diagnostic method and negotiation workshop.
Five of the eight margin erosion risks in Pricing Insight's diagnostic method touch negotiation directly: undefined value drivers, the commodity mindset, discounting to win or keep business, negotiating with procurement using standard sales techniques, and the inability to implement a price increase. A sixth, a convoluted pricing structure, gives buyers a weapon: when exceptions outnumber rules, customers learn which person to ask for a better price.
02Before the meeting: four issues in preparation
Sellers cannot cost a concession
Elements: 32 Nu Commercial numeracy
Three figures decide what a concession costs, and most sellers see only one. They see the list price and the discount. They seldom see the price the business keeps once rebates, freight, settlement discounts and credits are paid, or the extra volume a discount needs to pay for itself.
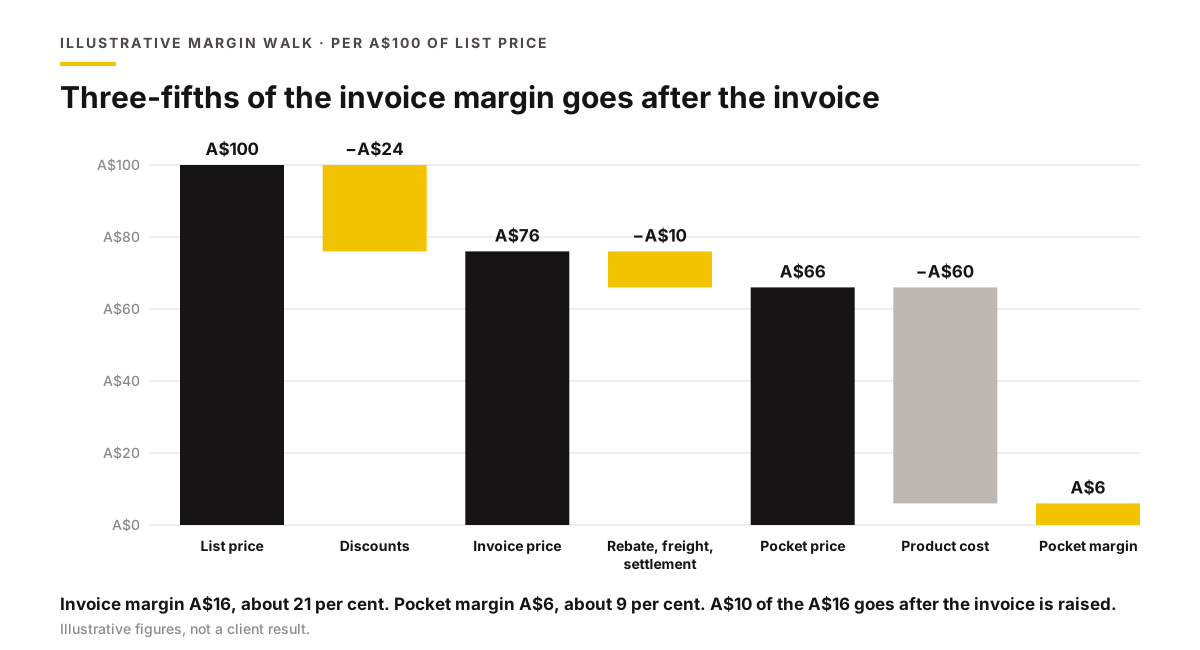
In an illustrative margin walk, a product listing at A$100 is invoiced at A$76 after customer and special discounts. Off-invoice items take a further A$10: a A$5 rebate, A$3 of freight and small orders, and a A$2 settlement discount. The business keeps A$66, against a product cost of A$60. The invoice margin is A$16, about 21 per cent. The pocket margin is A$6, about 9 per cent. Where the sales report shows only the invoice margin, a poor deal can look like a good one.
The second figure is break-even volume. A price cut comes almost straight off profit, so a discount needs extra volume to stand still: extra volume needed = discount ÷ (gross margin − discount). At a 30 per cent gross margin, a 5 per cent discount needs 20 per cent more volume. At a 20 per cent margin, a 10 per cent discount needs twice the volume.
| Gross margin | 2% discount | 5% discount | 10% discount |
|---|---|---|---|
| 20% | 11% more volume | 33% more volume | 100% more volume |
| 30% | 7% more volume | 20% more volume | 50% more volume |
| 40% | 5% more volume | 14% more volume | 33% more volume |
Exhibit 2. Extra volume needed for a discount to break even. Illustrative arithmetic: discount ÷ (gross margin − discount).
Mark-up is the third trap. A product costing A$70 and selling for A$100 earns a 30 per cent margin and a 43 per cent mark-up. A seller who adds 30 per cent to cost, thinking it is margin, prices at A$91 and earns about 23 per cent, and the error repeats on every line of the quote. Staff at client businesses describe the gap plainly. A salesperson at a timber and building-products distributor wrote: "With my veneer customers I try to stick with a 30% margin but sometimes drop to 25% all depends on volume. Which I don't think has a huge impact on EBIT." That drop cuts the price by about 7 per cent, removes more than a fifth of the margin dollars on each sale and needs about 29 per cent more volume to earn the same profit.
The opportunity. A margin walk for each major account, and the break-even rule applied before any discount is offered. In one workshop exercise at a plywood and panels distributor, a team traced a laminate panel listing at A$360 down to earnings of about A$3.40 a unit after discounts and overheads. Trimming one tactical discount, so the invoice rose by A$20, lifted modelled earnings to about A$23.40 a unit. One of the team called it "eye-opening". The figures were modelled in a course exercise, with no result reported.
No walk-away, or one built on product cost
Elements: 35 Wa Walk-away and alternatives; 39 Ka Key-account negotiation plans
Many sellers go into a negotiation with no floor at all, and a seller with no floor concedes until the buyer stops asking. One staff member at a timber and building-products distributor described the result: "The tendency to go to the lowest pricing level as a first step, means there is nowhere to go as a last resort."
Where a floor exists, it is often built from product cost alone. In an illustrative case, a product costs A$70 and the business needs A$10 of contribution, so a cost-plus walk-away is A$80. Freight to this customer adds A$3, taking the net walk-away to A$83, and a 3 per cent rebate on the invoice takes it to A$83 ÷ 0.97, about A$86. Every deal struck between A$80 and A$86 misses the minimum the business set.
The buyer's alternative is the other half of the walk-away. Buyers talk about their alternatives often, and sellers seldom have evidence against them. Five checks test it: the realistic rival and whether it can deliver, the customer's cost of switching, whether the customer has gone to market or only mentioned it, how past renewals were settled, and whether orders are already falling.
The opportunity. A one-page plan for each significant negotiation, with an opening, a target and a walk-away, built from the full cost to serve and approved before the meeting by the people who own the limits. Our paper on preparing for price negotiations sets out the plan in full.
Value is described and never measured
Elements: 03 Vq Value quantification; 29 Vs Value selling; 30 Vt Value marketing and sales tools
Sales teams rate their business as differentiated, on service, technical capability, range, terms and reliability, and then price it like a commodity. In our diagnostics this gap is the most consistent finding of all. Value is described in adjectives such as quality, service and partnership, and a buyer can dispute an adjective at no cost. A seller who matches a rival quote without showing that value sets the customer's new reference price, and the next negotiation starts lower.
Staff see the value that goes unpriced. A salesperson at a timber distributor wrote about a builder's 7am delivery: "the ability to rely on that could be more important than a discount if the delivery on time means less downtime for the workers on site who are charging an hourly rate." A leader in the same business compared a premium hardwood cavity unit with a cheaper range: "We would have 10-15 issues a year with the [cheaper] cavity units which end up costing the builder a substantial amount of money and time to fix. In the past 16 years I have only ever had 3 problems with the [premium] cavities and 2 of them were installed incorrectly."
The opportunity. A value case in the customer's dollars, built with Customer Value Discovery: 22 questions, six value frames across value in use and value at risk, scores against the main competitor, and the largest differences converted into figures the customer's finance team can test. A value case is large enough when it shows three to five times the price gap. In an illustrative case, a builder buying A$60,000 a year of framing timber pays 3 per cent, A$1,800 a year, above a rival. Crew time saved from three late deliveries avoided, at A$400 an hour for a crew of four, is worth A$4,800; two callbacks avoided are worth A$3,000; six extra trips to site avoided are worth A$900. The total, A$8,700 a year, is about 4.8 times the gap.
Pricing power goes unused
Elements: 10 Pp Pricing power
Pricing power is the ability to hold or raise a price without losing profitable sales. It comes from the customer's need, the business's own strategy and structure, and how its negotiations, rebates and overrides are run. A customer with an urgent, complex or risky need gives the supplier more power than one with a planned, simple need. Much of that power is never used, because prices are set by habit.
At one branch of a timber and building-products distributor, builders often ordered beams at the last minute. Through a supply agreement, the branch could deliver next day to site, which most rivals could not. Special orders were still priced by a rule of thumb, with staff told to "put 23% on it" to meet the average margin. Staff proposed charges for urgent orders, timed drops and crane lifts. No result has yet been reported.
The opportunity. Each major account placed by how it sees the supplier, as a vendor won and lost on price, a supplier valued for service and quality, or a partner built into its supply chain, and by size and status. The placement sets the strategy and the tactics before any meeting. Services the customer values, such as urgent delivery, timed drops and technical support, are charged for and waived only on approval.
03In the room: four issues in the negotiation itself
Procurement is trained and sellers are not
Elements: 37 Bt Buyer and procurement tactics; 28 Cc Commercial capability and training
Professional buyers are measured on savings against last year's price, the budget or the first bid, and many are trained in anchoring, reciprocity, the take-away, time pressure and the rival quote. Category managers arrive with spend analytics, should-cost models and a record of every concession the supplier has granted. Sellers are more often trained in product knowledge and measured on revenue and win rate. Against a trained buyer, a seller with only relationship skills tends to concede.
The opportunity. A written response to each common tactic, rehearsed aloud in role-play before the meeting, and a business that names the tactics its buyers use most. Nine tactics account for most of what a trained buyer does: the rival quote, the switching threat, the cost story, one chance to quote, cherry-picking, open-book costing, the deadline, going over the seller's head, and risk transfer.
The rival quote is taken on the buyer's word
Elements: 34 Ng Negotiation skills; 11 Cm Competitive response rules
The rival quote is the commonest tactic and the most expensive to answer badly. Staff describe the habit plainly. One wrote of "dropping price because a customer said can you do any better". Another: "A lot of quotes are won because the customer tells us that they have a cheaper quote from elsewhere so they are then given a discount to beat the competitors quote." A third: "We take them on their word all the time instead of showing proof to match."
An Australian plumbing supplies distributor found the same pattern in its trade branches, where staff dropped prices whenever a customer said a competitor was cheaper and did not ask to see the quote. Competitor prices sent to head office drew no visible response, so staff checked large retailers' websites themselves. Three recommendations followed: a price-match rule requiring a quote or invoice, a competitor index on key lines updated every fortnight, and a published grid telling staff when to match, trade up or walk. They are recommendations, with no result yet reported.
The opportunity. Proof before price. No match without a quote or invoice the seller has seen, then one of four responses in order: hold and sell the value, trade by changing what is offered, match on a short list of key items above the floor, or walk away when the deal loses money once rebates and freight are counted. A rival quote that leaves out freight, cut-to-length, support or warranty is a lower price for less.
Concessions are given, early and in equal steps
Elements: 36 Cn Concession planning
Concessions are offered before the buyer asks, promised for the next order, and given with nothing back. Staff name each habit: "Giving away too much discount upfront before road mapping their business and needs." And: "When a discount is promised for a new upcoming order, instead of finalising it at the time of the solution. Customer will continue to expect discounts moving forward as standard."
Concessions also differ widely in cost. On a customer buying A$2 million a year, 30 more days to pay costs about A$13,200 a year at an assumed 8 per cent cost of funds, while a 3 per cent price cut costs A$60,000 a year and repeats on every order. A 5 per cent discount on an order of about A$400,000 at an 18 per cent gross margin costs A$20,000 of EBIT, and earning it back needs about A$111,000 of extra sales. The figures are illustrative.
The pattern of concessions carries its own message. In a training case, a seller who won a renewal opened at 12 per cent with cost evidence and moved to 9 and then 7 per cent, each step smaller and each traded, closing with a 36-month contract. A seller who lost the renewal opened at 4 per cent, apologetically, and moved in equal steps to 1 per cent with nothing received. Shrinking steps tell the buyer the limit is near; equal steps tell the buyer there is more to come.
The opportunity. A give-get list priced by Finance, ordered from the cheapest concession to the dearest: payment terms, then volume terms, contract length and service level, and price last. The condition comes before the concession, every concession is traded for something the business can measure, and each carries an expiry date.
The negotiation runs with the wrong person on the wrong price
Elements: 05 Dr Delivery reliability and value at risk; 39 Ka Key-account negotiation plans
Procurement is usually the buyer's agent. The economic buyer is the person who lives with the result: the site manager, the plant manager or the business owner. Procurement's scorecard rewards savings and a compliant process, and nothing on it rewards a line stoppage that never happened. Procurement will also try to place every supplier in its tactical box, where price decides. The commonest error in the room is a volume discount, given to hold the account, on an item the customer cannot do without.
The invoice price is one of four prices a customer pays. The operating price covers labour, energy and consumables in use; the repair, replacement and disposal price covers maintenance, callbacks and the cost of switching supplier; the risk price covers what the customer loses when supply, the product or technical support fails. Procurement is briefed on the first. A value case is written in the other three. In a teaching example, a premium excavator cost about A$29,000 more than a cheaper one over three years, and its parts and service record avoided about A$780,000 of downtime risk: the customer spent A$1 to avoid about A$27 of risk.
The opportunity. The value case taken to the economic buyer before the tender, and to procurement once it is on record, with the value at risk priced in the customer's own figures. In a hospital tender used as a training case, one bidder led with being 8 per cent cheaper; the other priced a lower re-admission rate in the hospital's own budget and won at about a 3 per cent premium.
04After the deal: three issues in what happens to the price
Price increases are given back
Elements: 38 Pv Price-increase negotiation
An increase is lost in two places: in the conversation, when a seller gives back part of the rise to avoid conflict, and after it, when one-off price cuts wear the new price down. Increases also fail because they are too small to cover the cost rise, too late after months of absorbed supplier rises, badly signalled, or one flat percentage that overprices some customers and underprices others.
Two Australian building-products makers, one making pipe and the other insulation, ran a general increase every year. Notice letters went to customers' accounts departments, the buyers who had to accept them heard late, and price lists arrived late. When buyers pushed back, account managers with no script, no evidence and no limit gave ground, and none of it was recorded as a concession. The recommendation was a price-increase playbook covering timing, letters to buyers, scripts for objections and tracking after each increase. It has not yet been measured.
Staff see the leak from inside. One wrote: "We pass on supplier price increases however not enough consideration to our own business cost increases i.e. wages, rent etc."
The opportunity. An increase sized from the cost rise (price rise needed = cost rise × (1 − gross margin)), spread by pricing power across the customer base, run as a sequence that starts months before the effective date, with any movement below target signed off by a director, and checked on the invoice at 30, 60 and 90 days. In an illustrative case, a 5.5 per cent increase on a customer buying A$2.4 million a year is worth A$132,000 a year before a 20 per cent rebate and A$105,600 after it, annualised. Applied for nine of the first twelve months, about A$79,200 would be realised in year one, and only once it is invoiced.
Rebates are paid on turnover and unseen at the quote
Elements: 16 Rb Rebate and incentive design; 15 Va Value-based agreements
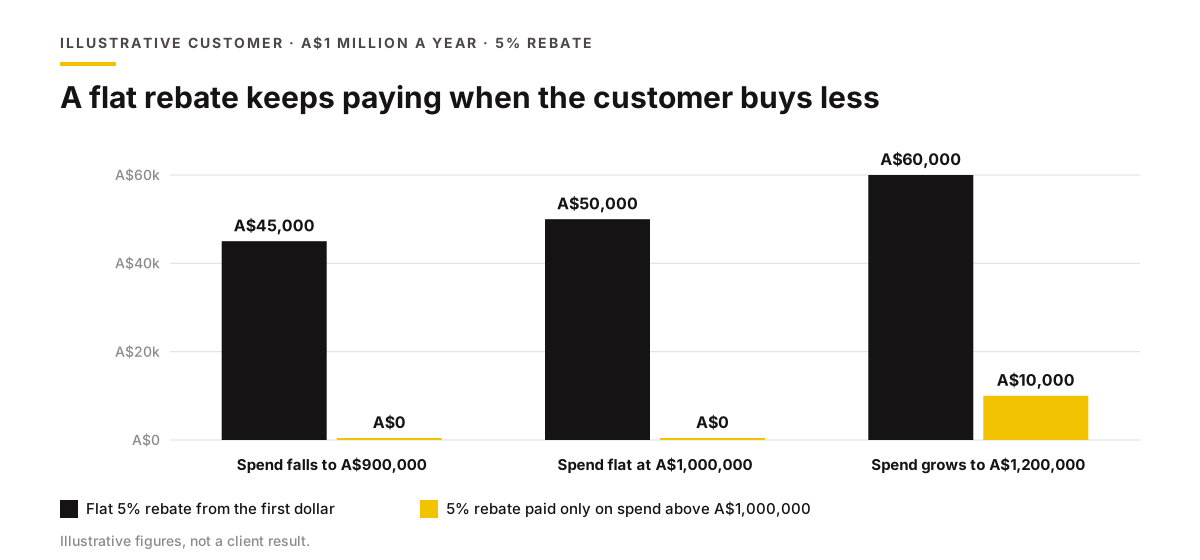
A rebate paid from the first dollar, with no cap, no check and no end date, works as a permanent discount. When the customer buys less, it keeps paying. In an illustrative case, a customer buying A$1 million a year at a 40 per cent gross margin earns a flat 5 per cent rebate of A$50,000, an eighth of its gross profit. If its spend falls to A$900,000, the flat rebate still pays A$45,000. A 5 per cent rebate paid only on spend above A$1 million pays nothing unless the customer grows.
Rebates also hide margin from the people who quote. A maker of compostable food packaging supplied a national contract caterer whose account showed an invoice gross margin of about 51 per cent, one of the best in the management reports. A rebate of 26 per cent of invoice sales sat outside the invoice. A line-by-line margin walk put the margin the business kept at about 33 per cent, in the lower half of similar customers. Each point of rebate was worth about A$33,000 a year, annualised. This was a diagnostic finding; no renegotiation result has been reported.
At a foodservice packaging supplier in Australia and New Zealand, rebates were worth about 2.3 per cent of gross sales, and almost all of them were paid on turnover, whatever the customer did. About A$3 million went to customer groups whose sales did not grow; one distributor's sales fell about 13 per cent while it kept a rebate of about 7.5 per cent. Resetting ten flagged groups at renewal was projected to be worth A$0.4 million to A$1.3 million a year. A staff member put the question every seller faces: "how do you maximise the margin with the customer when you don't know the rebate they receive".
The opportunity. Rebates that start above current spend, carry a cap, are checked against what the customer did, can be clawed back and expire, so they are earned again. Each rebate is judged by its return, the extra gross margin divided by the extra rebate, and every rebate is visible to the people who quote.
Special prices never expire
Elements: 19 Rn Contract renewal and renegotiation; 18 Tp Tender and project pricing
A special price given for one job is reused on the next. Builders buying steel formwork decking from one supplier were on A$50.15 a square metre; over time the price slid to A$49.00, because internal staff had seen a special rate given for one job and reused it, without telling the rep. A trade distributor of cabinet and architectural hardware found about 64,000 contract price lines in one state's architectural business that had no sales in twelve months, yet each was still a live price. Staff describe the same drift: "Sometimes the customer gets better pricing for a large project, but then the sales guys keep that cheap pricing on their small orders."
Contracts roll over the same way. An agreement that records only price gives the next renewal nothing to discuss but the rate, and one that rolls over by default carries every old concession forward. As one staff member put it: "Our contract pricing is just a price with no incentives for the customer to increase the spend (SOW) with us."
The opportunity. Every special and project price carries a reason, an owner, a project number, a quantity and an end date, in a register the people who quote can read. Renewals are planned back from expiry: 12 months of volume, mix, margin and rebate pulled at 120 days, the contract tested against its margin walk at 90 days, a negotiation pack ready at 60 days, and the conversation opened at 30 days on the value delivered. A nine-term checklist, from a price review clause and cost indexation to exit triggers, is run on every major agreement.
05Around the seller: authority, records and measures
No authority, no record and the wrong measure
Elements: 40 Dd Deal desk and negotiation governance; 61 Da Discount authority and controls; 42 Wl Win/loss analysis; 44 Or Override and discount analysis
Four structural gaps sit behind most of the issues above. Override authority is unclear, or approved by the person who asked for it. Overrides carry no reason code, so their cost appears only at month-end. Quotes won and lost are not recorded with the price and the stated reason, so no one can tell whether a discount changed the result. And sellers are measured on revenue and win rate alone, which rewards a seller who closes by conceding.
Pricing Insight's 9PE diagnostic reads the marketing, sales and negotiation domain in the context of management alignment and pricing capability. A weak sales domain with strong management and capability points to sales execution. A weak sales domain with weak management and capability points to structural change. Sales effectiveness is downstream of both.
People are part of the structure too. Most concessions come from the fear of losing the deal, or from the expectation of pushback and a wish to avoid the conflict. New tools change that behaviour more reliably than instruction: a walk-away the seller did not have to invent under pressure, other things to trade, and a manager who backs a decision to decline a deal below the floor.
| Structural gap | What it allows | Opportunity |
|---|---|---|
| No discount authority matrix | Discounts approved by the person who asked for them, or worked back to a margin threshold | Authority by role and dollar impact, with escalation below the floor |
| No reason codes on overrides | Margin lost to overrides seen only at month-end | A reason code on every override and a monthly report by seller, customer and dollar value |
| No record of quotes won and lost | No evidence of whether a discount changed the result | A central record of quotes with the price, the competitor price where known and the stated reason |
| Win rate as the only measure | Sellers rewarded for closing by conceding | Concessions given and what each bought, the gap from opening to close, deals declined below the floor, and the share of increases realised on the invoice |
Exhibit 3. Four structural gaps around the seller and the opportunity in each. Source: Pricing Insight diagnostic method.
06What the opportunity is worth
Most of the value sits in a small number of decisions taken before and after the meeting. At a foodservice packaging supplier selling hot cups, lids, takeaway containers and cutlery through six large distributors, each year's talks had come down to one number: the size of the increase. Before the next round, the pricing team built a negotiation pack for each account, showing its economics after rebates, where its prices sat against a fair price, what it bought against similar accounts, and the concessions on offer, in order.
Range held most of the value. A capped price rise averaging about 1.2 per cent was worth about A$0.3 million a year across the six accounts; the gaps in range were worth about A$1.5 million a year in gross margin. The keenest-priced distributor could carry a rise of only about 0.4 per cent, yet it had the largest range gap. On accounts with rebates, about 4 to 7 per cent of any increase flowed back through volume-linked rebate lines. The supplier ran three accounts as price-led negotiations and two as range-led conversations, with every concession list approved before any meeting. The gain was projected at about A$1.9 million a year across the six.
| Source of value | A year | Status |
|---|---|---|
| A capped price rise averaging about 1.2 per cent | About A$0.3 million | Projected |
| Closing gaps in the range each distributor bought | About A$1.5 million of gross margin | Projected |
| Total across six distributor accounts | About A$1.9 million | Projected; parts rounded |
Exhibit 4. Where the value sat in one supplier's distributor negotiations. Source: Pricing Insight, as reported in the Pricing Periodic Table, CXO Edition. Projected figures; not a measured result.
The profit arithmetic explains why small moves matter. At a 4 per cent EBIT margin, a 2 per cent price cut halves operating profit if nothing else changes, and a 2 per cent price rise lifts it by half. In a worked example, a business with A$200 million of addressable revenue and a 5 per cent EBIT margin earns A$10 million of EBIT; 75 basis points of realised price adds A$1.5 million of EBIT a year, annualised, an increase of 15 per cent, with volume, costs and working capital unchanged. That is arithmetic on stated inputs, and the in-period benefit depends on when contracts renew.
07Three published cases
Three published cases show the opportunities taken. They describe what happened in those businesses and are not benchmarks for another.
| Client | Issues addressed | What was done | Outcome and status |
|---|---|---|---|
| Devro, food manufacturing | 3, 8 | Customer Value Discovery across 21 value drivers, then sales teams in several countries through Pricing University | Higher price increases negotiated in Australia and New Zealand. Realised; not quantified in dollars |
| A foodservice packaging distributor, New Zealand | 2, 9 | A negotiation pack for one account worth about A$6 million a year: spend by category, comparison with similar accounts and a playbook | An 8 per cent increase, about A$480,000 a year. Realised, annualised |
| Allegion, door and architectural hardware | 2, 12 | A pricing diagnostic, then pricing governance, training for sales teams and a reset of deal discipline across channels | An EBIT gain of A$3.8 million to A$6.5 million. Identified and yet to be realised |
Exhibit 5. Three published cases and the issues each addressed. Source: Pricing Insight case studies and the Pricing Periodic Table, CXO Edition.
Allegion's staff named the issue before the work began. One wrote: "I think we often give away too much so we can get the sale rather than thinking about the long term profitability." Others asked for "more confidence to say no to a sale if it's not profitable".
08Where to start
Seven first steps, in the order that returns margin soonest and costs least to put in place. Each uses the business's own data and its own accounts.
| Step | What it produces | Issues |
|---|---|---|
| 1. Walk the margin on the largest accounts | Pocket margin after rebates, freight and credits, by account | 1, 10 |
| 2. Write three positions for the next five negotiations | An approved opening, target and walk-away for each | 2 |
| 3. Price the give-get list | Concessions ordered from cheapest to dearest, each with its return | 7 |
| 4. Adopt proof before price | A written rule and a match, trade or walk grid for rival quotes | 6 |
| 5. Put an end date on every special price | A register of special and project prices with owners and dates | 11 |
| 6. Plan the next increase as a sequence | An increase sized by account, with invoice checks at 30, 60 and 90 days | 9 |
| 7. Measure what is given away | A monthly report of concessions, overrides and quotes won and lost | 12 |
Exhibit 6. Seven first steps. Source: Pricing Insight negotiation workshop and diagnostic method.
The value case and pricing power work, issues 3 and 4, take longer, because they are built with customers. They also move the largest sums, as the six distributor accounts show.
09The Pricing Periodic Table elements behind the twelve issues
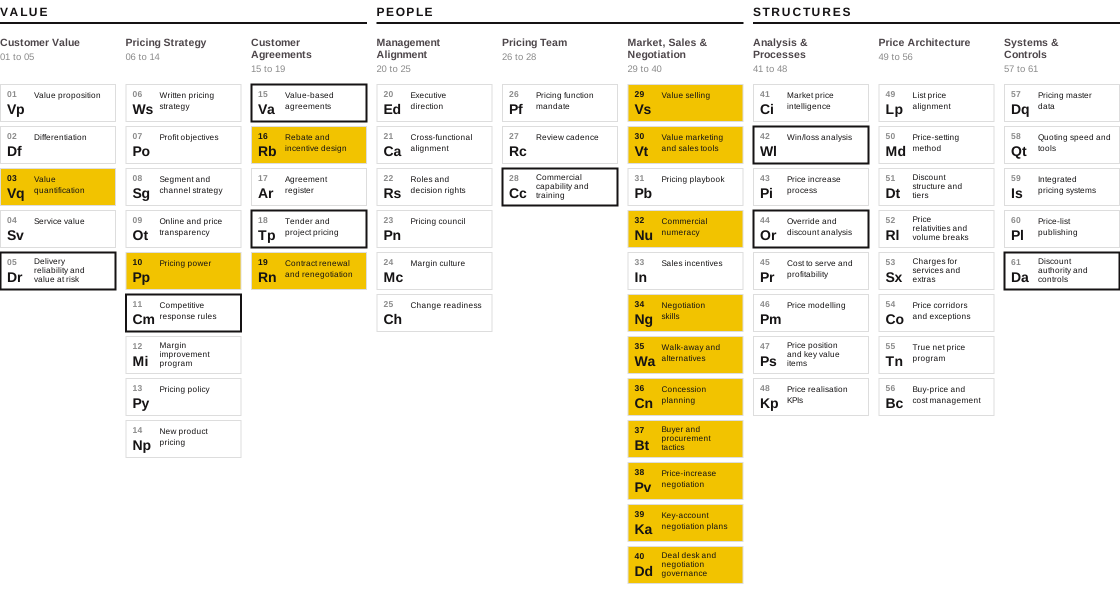
The Pricing Periodic Table has 61 elements in three pillars, Value, People and Structures. Fixing the twelve issues builds the fourteen shown in gold: 03 Vq Value quantification, 10 Pp Pricing power, 16 Rb Rebate and incentive design, 19 Rn Contract renewal and renegotiation, and ten of the twelve elements in the Market, Sales & Negotiation domain, from 29 Vs Value selling to 40 Dd Deal desk and negotiation governance.
Eight more are outlined because the fixes depend on them: 05 Dr Delivery reliability and value at risk, 11 Cm Competitive response rules, 15 Va Value-based agreements, 18 Tp Tender and project pricing, 28 Cc Commercial capability and training, 42 Wl Win/loss analysis, 44 Or Override and discount analysis, and 61 Da Discount authority and controls. Negotiation reaches across all three pillars, which is why a negotiation problem is seldom solved by negotiation training alone.
What are the most common problems in B2B price negotiation?
Twelve recur in Pricing Insight's diagnostic work: sellers who cannot cost a concession, no written walk-away, value described but never measured, unused pricing power, untrained sellers facing trained buyers, rival quotes taken on trust, concessions given early and in equal steps, negotiating with the wrong person on invoice price alone, price increases given back, rebates paid on turnover, special prices that never expire, and missing authority, records and measures.
Why do sales teams give away margin in negotiations?
Mostly for reasons outside the meeting: no written floor, no priced list of trades, rebates they cannot see, approvals that are easy to get, and a scorecard that rewards win rate. Fear of losing the deal does the rest. Tools, rehearsal and governance change the behaviour.
How can a business tell whether its negotiations are losing margin?
By walking the margin from list price to pocket margin on its largest accounts, and by recording concessions given and what each bought, the gap between opening and close, quotes won and lost with the price and reason, and the share of each price increase that reaches the invoice.
Is negotiation training enough to fix these problems?
Training addresses the issues in the room. The issues before the meeting and after the deal need preparation, rebate design, contract terms and governance as well. Of the fourteen Periodic Table elements behind the twelve issues, several sit in customer agreements and price governance.
Where is the biggest opportunity in B2B negotiation?
Often outside the price itself. In one supplier's distributor negotiations, closing gaps in the range each distributor bought was projected to be worth about five times the price increase. Rebates paid on turnover and special prices without end dates are the other common sources.
10How Pricing Insight helps
The twelve issues are diagnosed, fixed and embedded in three stages, each drawing on evidence from the client's own transactions. Negotiation Training & Value-Based Selling works on the team's own key accounts and the negotiations coming up, and Pricing University teaches the method and the arithmetic. Pricing Insight has completed 160+ engagements, and price optimisation programs return between 5 and 10 times their cost in year 1.
Diagnose
The margin walk by account, concessions given and what each bought, rebates and special prices in force, and the authority limits in use, sized against a baseline Finance accepts, through the Strategic EBIT Opportunity & Risk Diagnostic.
Optimise
Walk-aways and give-get lists for key accounts, value cases from Customer Value Discovery, rebate redesign and price corridors, with the EBITDA Improvement Program setting the fair prices each negotiation is measured from.
Transform
Sellers trained on their own accounts, a deal desk and discount authority matrix in place, and measures of what is given away reviewed each month, through Pricing Capability & Governance.
Which of the twelve issues is costing your business most?
A first conversation establishes how this applies in your business and whether a diagnostic is warranted. Ron Wood, +61 410 534 099.
Ron Wood is the Founder and Managing Director of Pricing Insight, an Australian pricing strategy consultancy he established in 2007. He has worked in pricing for 30 years, first as a pricing and commercial manager in consumer goods, building materials and capital equipment, and since then across 160+ engagements in Australia, New Zealand, South East Asia, India, the United States and the United Kingdom. He also founded Pricing University and is the author of the Pricing Periodic Table, CXO Edition.
To discuss how this applies to your business, contact Ron Wood or call +61 410 534 099, or email info@pricinginsight.com.au.
Devro is a realised result as published in a Pricing Insight case study and is not quantified in dollars. The Allegion figure is an identified opportunity as published. The New Zealand foodservice packaging distributor figure is realised and stated as an annualised value. The six-distributor, rebate and caterer figures are projected or diagnostic findings, as labelled. Clients other than Devro and Allegion are described by industry only and are reported in the Pricing Periodic Table, CXO Edition; staff are quoted without names. The margin walk, break-even, walk-away, value case, concession, increase, rebate, excavator, hospital tender and EBIT figures are illustrative or training figures. Results are as reported by Pricing Insight and have not been independently audited. No figure in this paper is typical or guaranteed.