


White paper · Diagnose · 25 min read
Sources: Pricing Insight engagement analyses, anonymised where the client has not approved publication; the Pricing Periodic Table, CXO Edition; Bunzl case study, published. Identified and modelled figures are not realised results.
Nine extracts and twenty-four months of invoice lines. That is the data request Pricing Insight issues at the start of a Strategic EBIT Opportunity & Risk Diagnostic, and the first of the nine does most of the work: every invoice and credit line for the past two years, at line level, with the customer code, the item code, the quantity, the net value and the cost of goods on each row. The other eight explain the first. Price conditions and specials say how each price was arrived at. The customer master and the product hierarchy say which customers and items are comparable. Agreements, rebates, credits and freight carry the money that leaves after the invoice is raised. Cost sets the floor. Quotes and win/loss records show the prices the business asked for and did not get. Together they let finance agree a baseline, walk the price from list to pocket for every large account, measure how far one item's price spreads across comparable customers, and put a figure, a source and a status word on every line of the opportunity register.
For a distribution business the request is the same in shape and larger in volume. More items, customers, branches and ways to set a price mean the tables that record specials, overrides and branch variations carry more of the answer. At a cabinet and architectural hardware distributor, roughly 384,000 customer and product combinations each carried their own negotiated price, none of it visible in the sales report and all of it visible in the price conditions table. This paper sets out the request table by table, the tests each passes, what we do when a field is missing, how the diagnostic uses the data, and how the data is handled. The companion paper on pricing systems, data and controls covers the fixes.
The question this paper answers
What data a pricing diagnostic needs from an ERP, table by table, how each table is tested, and what the diagnostic does with it.
Five Pricing Insight clients show what the request finds and what it is worth once the data joins. Tradelink, a foodservice packaging supplier, a cabinet and architectural hardware distributor, Bunzl and Staples each appear below in the same six-part form: the problem and what it put at risk, why it was hard to fix, what Pricing Insight did, the outcome with its status, the benefit to the client, and the Pricing Periodic Table elements the work built.
01Line-level invoices, not the sales report
Reports average. The sales report a distributor already runs shows revenue and gross margin by customer, product group and month, and each figure is a mean that has absorbed the spread between the highest and lowest price paid for the same item. The diagnostic exists to find that spread, so it starts at the invoice line, where each row still carries one customer, one item, one quantity, one price and one cost on one day. From those rows we compute every median, percentile and distribution ourselves. No statistics are asked of the client's IT team.
Two years, to the most recent complete month. Twelve months gives the current position; the second twelve shows which prices moved and whether the last increase reached the invoice on a like-for-like set of customers and items. Credits are included as negatives, GST is excluded, and customer and item codes are kept consistent across the period and every extract, because the whole analysis depends on the lines joining to the masters.
At a building products distributor selling more than 25,000 products through branches, resellers and cut-to-size services, the request was three extracts: transaction lines, the customer master with twelve months of ordering behaviour, and the item master with every hierarchy level the system held. CSV files in the same column order were as acceptable as the workbook. Of the five instructions on the cover sheet, the one that mattered most was the fourth: keep the codes consistent so the files join.
02Nine tables, and what each one proves
Each table answers one class of question, and the field list for each is short enough to pull from most business systems without a project. The columns below are the minimum. A business that holds more hierarchy levels, more price history or more reason codes should send all of it, because every extra level is one more way to tell an earned price difference from an unearned one.
| Table | Fields requested | What it proves |
|---|---|---|
| Invoice lines | Invoice date; invoice or credit number; customer code; ship-to; branch; salesperson; item code; quantity and unit of measure; gross value; discount; net sales value ex GST; cost of goods at sale; list price at sale if held; freight charged. Twenty-four months, credits as negatives. | The final invoice price for every customer and product pair, its dispersion across comparable customers, the list-to-invoice step of the waterfall, and the baseline finance signs. |
| Price conditions and specials | Reference and list price history; customer price groups; category and service prices; contract and project prices; special prices with approver; effective and expiry dates. | How each invoice price was arrived at, what each customer was entitled to against what it paid, how many specials have no end date, and where discounts stack. |
| Customer master | Customer code and name; parent or buying group; trade type and segment; channel; region; branch; account manager; payment terms; price group or contract flag; account open date; status; number of ship-to locations. | Which customers are comparable. Size bands are built after buying groups are consolidated to the parent, so true size is recognised before any discount is judged earned. |
| Product master and hierarchy | Item code and description; every hierarchy level held, at least four from range to item; brand and supplier; unit of measure and pack; current list price; standard or landed cost; status and lifecycle; substitutes; made-to-order flag. | Product relativities, the tree that any future discount rule is set on, the key value items customers compare, and which items should never be compared with each other. |
| Agreements and rebates | Agreement register: customer, price basis, rebate type and rate, tiers and targets, period, review and notice provisions, exclusions, renewal date. Rebate accruals and payments by customer and period. | The pocket price for every large account, which rebates are incremental and which pay on all volume, and which agreements have expired without anyone noticing. |
| Credits and returns | Credit note lines with reason code, linked invoice, customer, item and value. | Credits caused by pricing errors, returns as a cost to serve, and the share of net sales that is reversed after the invoice. |
| Freight | Freight charged on the invoice; freight cost incurred by delivery or by customer; delivery count and drop size. | Freight recovered against freight spent, by customer, and the accounts whose delivery pattern costs more than their margin. |
| Cost | Landed cost history by item with effective dates; costing method; supplier rebates where they alter landed cost. | Floors and margin by line, and the timing of cost movements against price movements. Used for floors and financial validation, never as the basis for setting a customer price. |
| Quotes and win/loss | Quote date; customer; item or project; quoted price and quantity; result; competitor named; reason; turnaround time. | The prices the business asked for and did not get, how long a quote waits, and whether price matches were made on a sighted competitor price or a claimed one. |
03Three tables that are usually incomplete
Specials without an end date. A special price is a decision about one job, one period and one customer, and in most price files it was loaded without the date on which it stops. At the hardware distributor, a price agreed for one project stayed live after the job finished, was used on later orders by the same customer and sometimes by others, and missed the annual increase. A price conditions extract with no expiry column is a finding before it is a data gap.
Rebates booked somewhere else. The invoice line shows the invoice price, and the rebate that takes the real price lower is accrued in a ledger account or a rebate module, by customer and quarter rather than by line. In the Pricing Periodic Table, CXO Edition, a national caterer's 51 per cent invoice margin became about 34 per cent once a 26 per cent rebate booked elsewhere was counted, and each percentage point of rebate on that account was worth about A$33,000 a year. The review's written conclusion, "recovery resides in the contract, not the price list", is the reason the agreement register and the rebate accruals are in the request. We join the records by customer and product and reconcile the result to reported gross margin.
Cost that is several numbers. One staff member in a diagnostic asked how a business could hold seven or eight different cost prices for one item. In the book's illustrative figures a product sells for A$100, the system shows a cost of A$70 and a margin of A$30, while landed cost plus freight is A$76 and the margin is A$24. A rep offers a A$5 discount, the screen shows A$25 left and the deal passes an approval band set at A$25. Real margin is A$19. The control worked exactly as designed, on the wrong number. At a foodservice packaging supplier, one takeaway-box line showed a gross margin of about minus 23 per cent, and the order of tests was an out-of-date list of materials, then inbound freight booked to the wrong cost, then a contract priced below cost. Finance fixes the first two as data errors.
Tradelink
Wholesale and distribution · 200+ branches · A$10.8m annualised margin opportunity identified
| Client and problem | Across more than 200 branches, staff did not trust the cost behind the price. Supplier rebates and price support sat behind invoice cost, so many sellers guessed their margin, and some special quotes went out at nil invoice margin on the assumption that rebates would cover them. |
| Challenge | The cost data was several numbers at once. The staff member quoted in section 03 asked how one item could carry seven or eight cost prices, and another described "constantly using expired contracts that report negatively", so expired price support showed false negative margins. |
| What Pricing Insight did | A pricing diagnostic across the branch network that set the price book, the overrides, the rebates and the price support against the transactions, followed by work to replace overrides with structure and sales enablement. |
| Outcome | An A$10.8m annualised margin opportunity identified across more than 200 branches, as published. Identified, not realised. |
| Benefit to the client | A margin opportunity sized against named causes in the data, and a view of net cost that lets the network stop pricing on rebates and price support nobody had checked. |
| Periodic Table elements built | 56 Bc Buy-price and cost management; 55 Tn True net price program; 57 Dq Pricing master data; 44 Or Override and discount analysis. |
Foodservice packaging supplier
Foodservice packaging · A$2m EBIT realised from pricing quick wins
| Client and problem | Two of the problems in section 03 came from this business. One takeaway-box line showed a gross margin of about minus 23 per cent, and a national contract caterer that looked healthy on the invoice, at 53 to 56 per cent site margins, earned 32 to 37 per cent once a rebate of 26 to 30 per cent of purchases, paid after the sale, was counted. |
| Challenge | Neither problem showed in the sales reports. The rebate was booked outside the invoice lines, and the negative margin had three possible causes, each with a different owner and fix. |
| What Pricing Insight did | Joined the rebate accruals to the invoice lines and reconciled them to reported gross margin, ran the cost tests in order, and put the caterer's rebate first in the next negotiation, ahead of invoice price. Pricing quick wins, a national price list architecture and a customised discount matrix followed. |
| Outcome | A$2m of EBIT realised from pricing quick wins, with a further A$6m to A$9m of margin opportunities identified, as published. The caterer account carried a projected opportunity of about A$180,000 a year; projected. |
| Benefit to the client | Realised EBIT, and a price cut avoided on an account whose invoice price looked high but whose net price, after the rebate, was already too low. |
| Periodic Table elements built | 56 Bc Buy-price and cost management; 55 Tn True net price program; 17 Ar Agreement register; 45 Pr Cost to serve and profitability. |
04Seven tests before any analysis is trusted
Validation comes before analysis, and it produces a written data-quality statement that goes to finance with the baseline. Seven tests cover most of it. The join rate: the share of invoice lines whose customer and item codes match the masters. One current cost per item, with zero costs, costs above price and costs unchanged for two years listed. One place in each tree: every product in one node of a hierarchy at least four levels deep, every customer in one node from channel to account, buying groups consolidated to a parent. A start and an end date on every contract and special price. Units of measure consistent across lines, price list and cost file, and a check that the system stores margin and not mark-up, or says which. Reconciliation of net sales and gross margin from the lines to reported results for the same period. Credits present as negatives and linked to the invoice they reverse.
The join test is where the book of priceable business is counted. At the hardware distributor, the customer master held 13,544 accounts. Of those, 11,528 had bought in the previous twelve months, and 9,859 had invoice lines complete enough to price. The 9,859 was the book the strategy priced.
Customer records at an anonymised cabinet and architectural hardware distributor, from the master file to the book of accounts with invoice lines complete enough to price. Counts from the engagement data; the strategy built on them is recommended, not a reported result.
Lines that fail the cost or product tests are held, not repriced and not discarded. At the same distributor about 1,200 lines were made-to-order codes or carried implausible cost data, and each was held at its current price in a quarantine register until its category owner fixed the data at source, with the target a register falling toward zero.
Cabinet and architectural hardware distributor
National trade distributor · 9,859 priced accounts · A$4.00m gross margin in year one, modelled
| Client and problem | Roughly 384,000 customer and product combinations each carried their own negotiated price, none of it visible in the sales report. The same item sold at prices up to 60 per cent apart between comparable customers. |
| Challenge | About a quarter of customer records could not be priced, about 1,200 lines held unreliable cost or product data, and volume and size together explained only a small part of the spread. |
| What Pricing Insight did | The join, quarantine and dispersion tests in sections 04 and 06, then measured increases within a cap on any one line, piloted on Lighting and Drawer Systems first. |
| Outcome | About A$4.00m of gross margin in year one, lifting gross margin from 33.6 to 34.9 per cent, with price dispersion falling from 26.4 to 22.5 per cent. Modelled in a recommended strategy, not realised. |
| Benefit to the client | A modelled margin gain built only on lines that passed the data tests, with no line moved beyond the cap, which keeps unreliable cost or product data from setting a customer price. |
| Periodic Table elements built | 57 Dq Pricing master data; 44 Or Override and discount analysis; 46 Pm Price modelling; 51 Dt Discount structure and tiers. |
05A missing field is left blank, never filled with zero
Leave the column blank and say so on the cover sheet. A zero is read as a price or a cost of nothing and distorts every distribution it enters; a blank is recognised as missing and the models work around it. An incomplete extract is more useful than a delayed one, and we would rather map a client's terminology than have the IT team re-cut the data to match ours.
Most gaps have a substitute. Account open date is replaced by the date of the first transaction. Order patterns are derived from order-level data rather than asked for as calculations. Cost at sale is replaced by current standard cost, and the floors and margin by line carry that caution; the dispersion analysis does not depend on cost at all. Rebates held only as accruals are allocated to the customer and period for the pocket-price view, with the invoice-price view kept separate.
Some gaps are findings. An empty quotes table is the usual case, because nothing in the business records why a quote was won or lost. The diagnostic then relies on the last ten significant lost quotes, pulled by the sales director with a note on whether a competitor price was ever sighted, and logging starts from that week. A price conditions table with no approver field or a rebate register with no end dates is written into the capability assessment against the element it belongs to.
06What the diagnostic does with the data
Finance agrees the measures first. Before any figure is reported, finance and Pricing Insight agree how final invoice price, price movement, price floors and attribution are calculated, and how the analysis reconciles to reported results. Every material finding then states its source, its calculation, the cohort it affects and its evidence limitation. Annualised run rate and benefit realised on completed invoices are reported separately. The baseline is signed, and every later gain is measured against it like for like, on the same customers and products in both periods.
The waterfall comes next. For the twenty largest accounts, then every account, the price is walked from list to invoice to pocket: the standard discount from the price conditions, the invoice price from the lines, then the off-invoice items from the agreements, rebate, freight and credits tables. The difference between invoice margin and pocket margin, in basis points, is the first number a CFO sees.
Dispersion is measured on the lines joined to the masters: for every item, the spread between the highest and lowest price comparable customers paid. Two tests separate earned differences from unearned ones. A price-volume relationship is fitted for every product, and customer margin is compared with customer size across the book. At the hardware distributor, volume explained about a tenth of the price differences within a product and size about a quarter of the variance in customer margin; the rest was negotiation and history.
Everything goes into an opportunity register. Each pool is named by mechanism: specials past their job, overrides below the agreed price, lines sold below floor, freight spent and not charged, rebates paying for volume the business would have had anyway, dispersion that neither volume nor size explains. Each carries the table it was measured from, the dollar figure, the customers and items affected and a status word: identified when the data shows it, modelled when a change has been priced against it, realised when finance has measured it against the signed baseline. The published results show the scale: at Tradelink, A$10.8m of annualised margin opportunity identified across more than 200 branches; at Farmlands, A$3.5m to A$6.2m of EBIT identified, with overrides a central part of it; at Staples, A$6.8m of EBITDA realised within 12 months on A$80m of addressable revenue; at Bunzl, A$5.7m of EBIT improvement realised from price optimisation across 18,000 SKUs. None is a benchmark for another business.
Bunzl
Global distributor · 18,000 SKUs · A$5.7m EBIT improvement · Realised
| Client and problem | Bunzl's margins were shrinking as volume grew, and frequent overrides in tenders took prices below where the business needed them. |
| Challenge | The range ran to 18,000 SKUs across more than one division, and tender prices were set deal by deal through overrides rather than from a price structure, so the evidence for a better structure sat in the transaction lines rather than in any report. |
| What Pricing Insight did | Project Blackbird price optimisation from Bunzl's own transaction data: price ladders by SKU and customer segment, discount guardrails that set how far a price could move, and a two-division pilot before wider rollout. |
| Outcome | A$5.7m EBIT improvement reported following price optimisation across 18,000 SKUs, realised. The CXO Edition reports, for the same work, 8 points of gross margin on targeted SKUs, overrides down 35 per cent and 98.3 per cent of customers kept, all realised. |
| Benefit to the client | Higher margin with almost all customers retained, and a third fewer overrides, which leaves less margin exposed in tenders. |
| Periodic Table elements built | 46 Pm Price modelling; 54 Co Price corridors and exceptions; 44 Or Override and discount analysis; 48 Kp Price realisation KPIs. |
Staples
Office supplies distributor · A$6.8m EBITDA within 12 months · Realised
| Client and problem | Revenue was up 5 per cent and profit down 3 per cent, with representatives discounting 5 to 15 per cent on a 6 per cent EBIT margin. The revenue report hid it: margin had shrunk by about 1.5 per cent while revenue grew. |
| Challenge | The discounting sat across about 5,000 items and every customer that bought them, so no summary report could show which customer and product prices were too low and which were right. |
| What Pricing Insight did | An SKU-level diagnostic from the transaction lines, quick wins, then algorithmic pricing that set one recommended net price for each customer and product. A starting point was recorded before any price moved. |
| Outcome | A$6.8m EBITDA within 12 months on A$80m of addressable revenue, realised as reported by Pricing Insight. The CXO Edition reports margin up about 7.4 percentage points within 12 months against the recorded starting point, realised. |
| Benefit to the client | EBITDA realised inside a year, measured against a baseline agreed before the change, which is the condition section 06 sets for counting any gain. |
| Periodic Table elements built | 46 Pm Price modelling; 57 Dq Pricing master data; 48 Kp Price realisation KPIs; 59 Is Integrated pricing systems. |
Three things are safe to read from the five cases. Speed: at Staples the A$6.8m of EBITDA was realised within 12 months, and at the foodservice packaging supplier A$2m of EBIT came from quick wins, in both cases from transaction data the business already held. Size: the realised results are A$5.7m of EBIT at Bunzl, A$6.8m of EBITDA at Staples and A$2m of EBIT at the foodservice packaging supplier; the identified opportunity at Tradelink is A$10.8m and the modelled year-one gain at the hardware distributor is A$4.00m of gross margin. Risk: in each case the tests in this paper stopped a price being set on a number that was wrong, whether a cost that was several numbers, a rebate booked elsewhere, a line with implausible cost data or a margin the revenue report hid. Identified and modelled figures are not results, and none is a benchmark for another business.
07Where each figure in the waterfall comes from
One account, illustrative, using the figures in the Pricing Periodic Table, CXO Edition. List price is A$100 and the customer's standard discount takes the invoice to A$80, so invoice margin against a A$60 cost is A$20, or 25 per cent. Below the invoice sit a A$6 rebate, a A$2 prompt-payment discount and A$4 of absorbed freight. Pocket price is A$68 and pocket margin A$8, about 12 per cent. Three-fifths of the invoice margin goes after the invoice is raised, and each step is read from a different table.
| Step | Amount | Table it is read from |
|---|---|---|
| List price | A$100 | Product master, with price conditions for the history |
| Standard discount | −A$20 | Price conditions (entitlement) and invoice lines (what was applied) |
| Invoice price | A$80 | Invoice lines |
| Rebate | −A$6 | Agreement register and rebate accruals |
| Prompt-payment discount | −A$2 | Agreements and payment terms on the customer master |
| Freight absorbed | −A$4 | Freight charged against freight incurred |
| Pocket price | A$68 | Derived |
| Cost | −A$60 | Cost table, tested against landed cost |
| Pocket margin | A$8 | Derived: about 12 per cent against 25 per cent on the invoice |
Illustrative waterfall from the Pricing Periodic Table, CXO Edition, with the source table for each step. Not a client result.
Leave a table out and the account looks better than it is. Without the agreements table the account shows A$80 and a 25 per cent margin, and the A$6 rebate is paid out of a profit that was never there. Without the freight table the pocket price rises A$4 it never earned. Without a tested cost the floor is set on a number that may be two years old.
08The elements the data request builds
The Pricing Periodic Table sets out 61 elements of pricing capability in nine domains, across Value, People and Structures. The data request builds eight of them directly, because a table that is asked for, tested and joined is the first working version of the element that depends on it. Pricing master data (57 Dq) is built by the validation itself. Buy-price and cost management (56 Bc) starts with the cost table tested against landed cost. True net price (55 Tn) and cost to serve and profitability (45 Pr) come from the agreements, rebate, freight and credit tables joined to the lines. Override and discount analysis (44 Or) sets the price conditions against what the invoice lines show was applied. Price realisation KPIs (48 Kp) are defined when finance agrees the measures. The agreement register (17 Ar) exists once the agreements table carries owners and end dates. Win/loss analysis (42 Wl) begins with the quotes table, or with the finding that there is none.
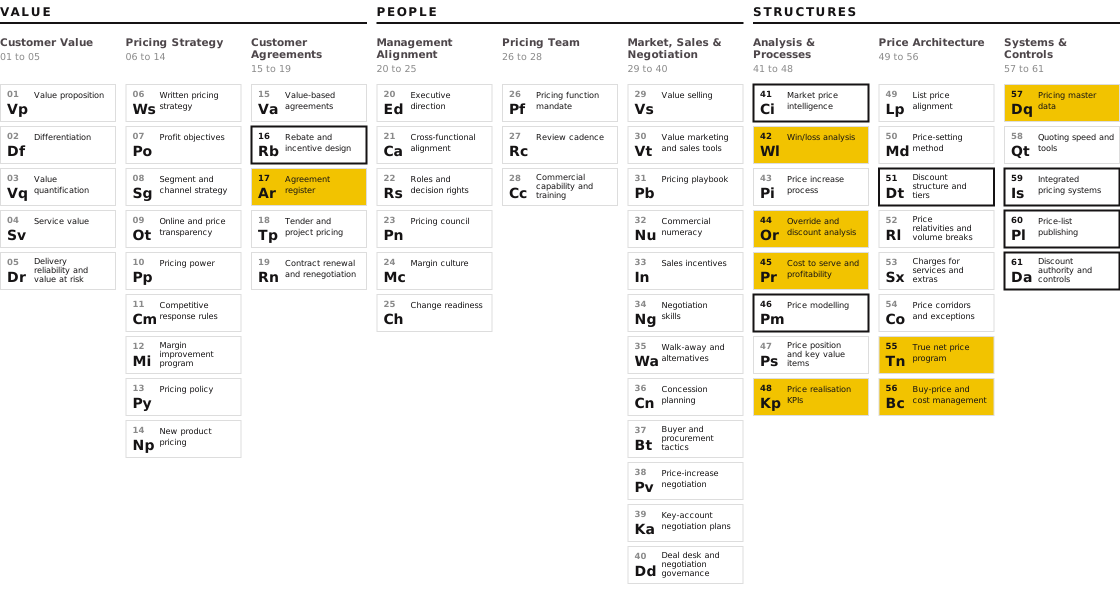
Seven more are identified by the request and built later. Integrated pricing systems (59 Is) and discount authority and controls (61 Da) are the subjects of the companion paper. Price modelling (46 Pm), discount structure and tiers (51 Dt) and rebate and incentive design (16 Rb) take the validated base as their input. Market price intelligence (41 Ci) sits outside the ERP, and price-list publishing (60 Pl) is tested by producing one customer's list from the records the invoice uses and checking ten lines at random against the last invoiced price.
The client cases map onto these elements directly. Tradelink and the foodservice packaging supplier built 56 Bc and 55 Tn, because a cost that is several numbers and a rebate booked elsewhere both make the invoice margin wrong. The hardware distributor built 57 Dq through the join tests and the quarantine register, and 44 Or through the dispersion tests. Bunzl and Staples took the validated base into 46 Pm, the outlined element, and measured the result through 48 Kp against a recorded starting point.
09How the data is handled
Confidential data is used only for the engagement and is accessed by named people. Customer-identifying data does not leave the project team, a non-disclosure agreement is signed where the client requires one, and the secure transfer method is agreed with the client's data lead when the request is issued. Customer names and item descriptions can be de-identified before extraction, because the work runs on codes and the business can hold the key. The outputs belong to the client; Pricing Insight's analytical methods and software remain its own.
10The sequence
Issue the request. Pricing Insight sends the data request, the field definitions and the secure transfer method to the client's named data lead at mobilisation, with one tab per extract showing the columns, the format and one example row.
Validate and state. The extracts are joined and the seven tests are run. The data-quality statement records the join rate, the cost exceptions, the specials without end dates, the reconciliation and every field that was missing or substituted. Finance reads it before it signs the baseline.
Agree the measures and start. Finance and Pricing Insight settle how final invoice price, price movement, floors and attribution are calculated, and the baseline is signed. Analysis starts the day the data is validated: the waterfall for the twenty largest accounts, then dispersion across the book, then the opportunity register. Where a table could not be supplied, the register says so, and the gap becomes an item on the roadmap rather than a figure invented to fill it.
11Frequently asked questions
What data does Pricing Insight need from a client's ERP to run a pricing analysis?
Nine extracts. Twenty-four months of invoice and credit lines at line level, with customer, item, quantity, net value and cost of goods on each row. Price conditions and specials with effective and expiry dates. The customer master with parent, segment, channel, branch, terms and account manager. The product master with every hierarchy level held, list price and cost. The agreement and rebate register with accruals. Credits with reason codes. Freight charged and freight incurred. Landed cost history. Quotes and their outcomes where they are recorded. Raw lines are preferred; nothing needs to be summarised, and a missing field is left blank and noted.
How does Pricing Insight approach a pricing diagnostic for a distribution business?
From the invoice line up. The extracts are joined and tested, finance agrees the measures and signs a baseline, and the price is walked from list to invoice to pocket for the largest accounts and then the whole book. Dispersion is measured for every item across comparable customers, with a price-volume fit and a size-against-margin test to separate earned differences from unearned ones. Specials, overrides, below-floor lines, unrecovered freight and rebates without a target are sized into an opportunity register, each with its source table and a status word. Interviews, a capability assessment against the Pricing Periodic Table and customer evidence sit alongside the data, and the result is a roadmap with the first actions ranked by value, confidence and customer risk.
Do we need to summarise or aggregate the data before sending it?
No. Raw invoice lines are preferred and every median, percentile and distribution is computed by Pricing Insight from them. Aggregation removes the spread the diagnostic is looking for. CSV files in the same column order as the template are as acceptable as the workbook, values are ex GST, and credits are included as negatives.
What if our cost data is unreliable?
Send it anyway and say what you know about it. Cost is tested against landed cost on the highest-revenue items, and lines with zero, implausible or stale costs are held at their current price in a quarantine register until the category owner corrects them. Cost is used for floors and financial validation, not for setting customer prices, so the dispersion and waterfall analyses proceed while the cost file is repaired. A business that cannot say which of several costs is current has found its first finding before the analysis starts.
Which systems can the extracts come from?
Any system that can export invoice lines, price conditions and master files to CSV or a workbook. Extracts in past engagements have come from SAP and from Microsoft Dynamics 365 Business Central, among others, and where history sits in a system retired at a migration the older extract is sent with the same codes so the two years join. The grain of the data matters more than the system it comes from.
12How Pricing Insight helps
The starting point is the data request. Our Strategic EBIT Opportunity & Risk Diagnostic issues the nine-table request at mobilisation, validates and joins the extracts, agrees the baseline with finance, and sizes the opportunity register from the transactions behind it. The work then runs in the three stages every Pricing Insight engagement follows.
Diagnose
The nine extracts requested, tested and joined, with a data-quality statement finance reads before it signs the baseline. The waterfall for the largest accounts, dispersion across the book and an opportunity register with a source table and a status word on every line.
Optimise
The validated base becomes the input to the EBITDA Improvement Program: price recommendations by customer and product, floors and corridors set from the dispersion evidence, and ERP-ready files with effective dates, reason codes and exceptions, reconciled to the baseline.
Transform
Owners named for each data set, the quarantine register reported to a Pricing Council, and the review rhythm that keeps the data fit for the next refresh, through Value-Based Culture & Transformation. Commercial teams trained to read a margin waterfall through the Pricing Masterclass.
What would your invoice lines show once they join?
A first conversation establishes which of the nine tables your systems hold and whether a diagnostic is warranted. Ron Wood, +61 410 534 099.
Ron Wood is the Founder and Managing Director of Pricing Insight, an Australian pricing strategy consultancy he established in 2007. He has worked in pricing for 30 years, first as a pricing and commercial manager in consumer goods, building materials and capital equipment, and since then across more than 160 pricing engagements in Australia, New Zealand, South East Asia, India, the United States and the United Kingdom. He also founded Pricing University, which has trained more than 5,000 executives, and is the author of the Pricing Periodic Table, CXO Edition.
To discuss the data request for your business, contact Ron Wood at info@pricinginsight.com.au or on +61 410 534 099, or visit Pricing Insight.
The cabinet and architectural hardware distributor, the building products distributor and the foodservice packaging supplier in this paper are Pricing Insight clients described without identification. Their figures are counts from engagement data or recommended designs unless stated as realised, and none should be read as typical or guaranteed. The national caterer, the A$100 waterfall and the A$70 cost example are from the Pricing Periodic Table, CXO Edition, and the waterfall and cost figures are illustrative. Tradelink, Farmlands, Staples and Bunzl figures are as published in Pricing Insight case studies, with the status stated in each case. The Bunzl gross margin, override and customer retention figures and the Staples margin figure are as reported in the Pricing Periodic Table, CXO Edition. The hardware distributor's A$4.00m is modelled in a recommended strategy, and the foodservice packaging supplier's A$2m is realised as published. Staff are quoted by role only. Results are as reported by Pricing Insight and have not been independently audited.