


White paper · Diagnose · 14 min read
Sources: the 16% is Pricing Insight analysis of gross profit and revenue filed with the US Securities and Exchange Commission by the 500 largest listed manufacturers and distributors, latest fiscal year against the year before. Staples and Fletcher Insulation are realised results as published in Pricing Insight case studies, not independently audited. None is a benchmark for another business.
A gross margin gain of 150 basis points is worth as much as 5% more sales at the same margin, and it needs no new customer, product or plant. In the latest year one large manufacturer or distributor in six achieved it. This paper sets out how often gross margin moves, by how much, in which industries, and what the companies that gained say caused it, so a CEO or CFO can see where their own business sits and what a realistic target looks like.
The question this paper answers
How likely is my business to add 150 basis points of gross margin in a year, and what do the companies that do it have in common?
Key takeaways
- Across 500 large manufacturers and distributors, the median change in gross margin over the latest year was minus 7 bps. 47% widened their margin and 16% added 150 bps or more.
- Gains were most common in transport equipment, electrical and electronics, and petroleum, rubber and plastics. Distributors gained often but rarely by much: 55% widened margin and 1 in 49 added 150 bps.
- Sales growth helped. Companies whose sales grew more than 15% were about twice as likely to add 150 bps as those whose sales fell or held flat.
- Fewer than one in five of the companies that gained name pricing as a cause. Those that do report larger gains, a median of 121 bps against 89 bps for the rest.
Three Pricing Insight clients show the same result reached on purpose: Corporate Express Australia (later Staples), Fletcher Insulation and Bunzl Outsourcing Services, each in the same six-part form and each a realised result.
01Half of large manufacturers and distributors did not widen gross margin last year, and one in six added 150 basis points or more
Five hundred companies, one year. The analysis takes the 500 largest companies by revenue that report to the US Securities and Exchange Commission under manufacturing or wholesale distribution industry codes. The smallest has revenue of about US$1.1b. For each, gross margin is gross profit divided by revenue, as filed, for its latest fiscal year and the year before. Most years ended in December 2025; the rest ended between mid-2025 and mid-2026. Pharmaceutical and biotechnology makers are left out, because licence and royalty income distorts their gross margin.
The result is a tall, narrow curve with long tails. Half of the companies moved by less than 100 bps in either direction. The median moved minus 7 bps. Slightly more than half, 53%, lost margin. At the edges, 15 companies gained 500 bps or more, among them memory and optical chip makers and companies recovering from a loss-making year, and 22 lost more than 500 bps, among them chemical and confectionery makers and companies whose figures were distorted by large acquisitions.
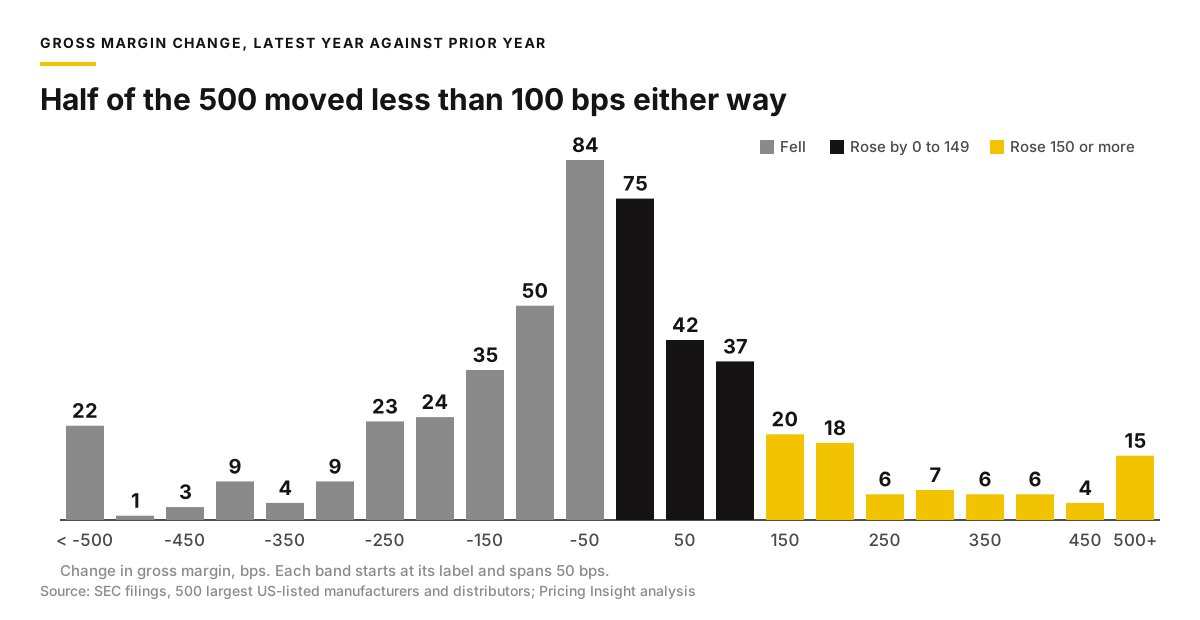
Read as a probability, the curve answers the question most boards ask first: what are the odds of a gain of a given size in one year? Exhibit 1 sets out the share of companies that reached each threshold.
| Gross margin change of at least | Companies | Share of the 500 |
|---|---|---|
| Any gain (1 bp or more) | 234 | 47% |
| 50 bps | 161 | 32% |
| 100 bps | 119 | 24% |
| 150 bps | 82 | 16% |
| 200 bps | 62 | 12% |
| 300 bps | 38 | 8% |
| 500 bps | 15 | 3% |
Exhibit 1. How often a gain of each size happened in the latest year. These are frequencies from one year of filings, not a forecast for any business. Source: SEC filings; Pricing Insight analysis.
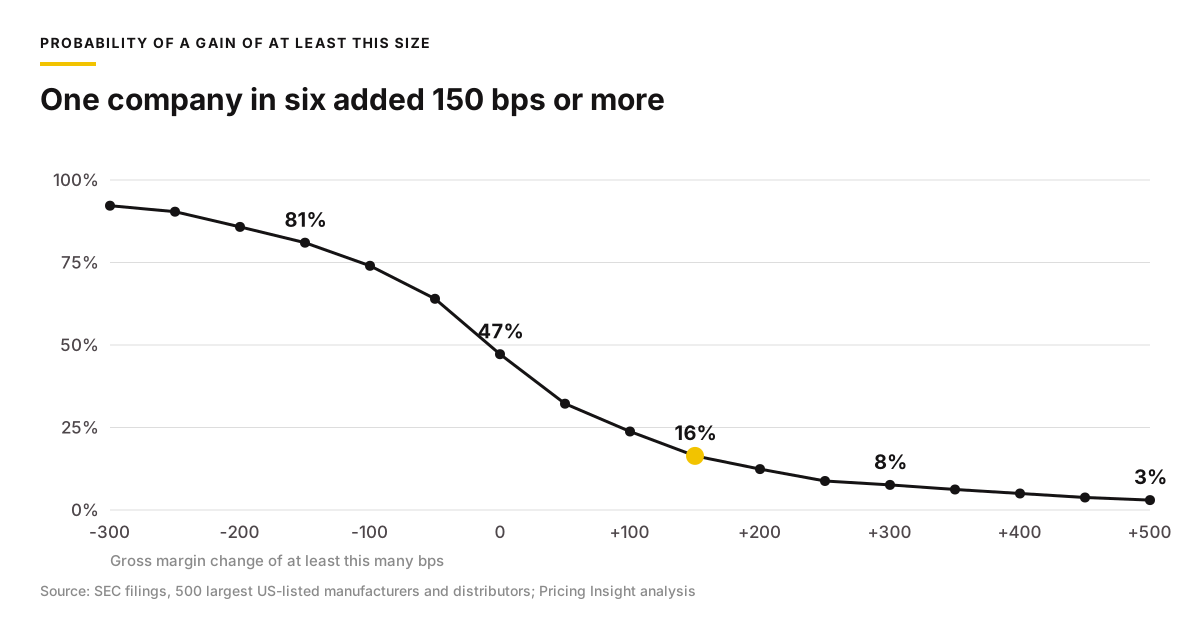
Two points follow for anyone setting a margin target. A gain of 50 bps happens in about one company in three, so it is a fair one-year goal for most businesses. A gain of 150 bps happens in one in six, so a plan that promises it needs a named cause, a named owner and a way to measure it. Size does not change the odds: across each fifth of the 500 by revenue, between 9 and 21 companies in every 100 added 150 bps or more, with no pattern from smallest to largest.
02Gains by industry: transport and electrical manufacturers gained most often, and distributors gained often but in small steps
Twelve industry groups, two different patterns. The 500 companies fall into twelve groups by industry code. Figure 3 ranks them by the share that added 150 bps or more, and shows the share that gained at all and the median change.
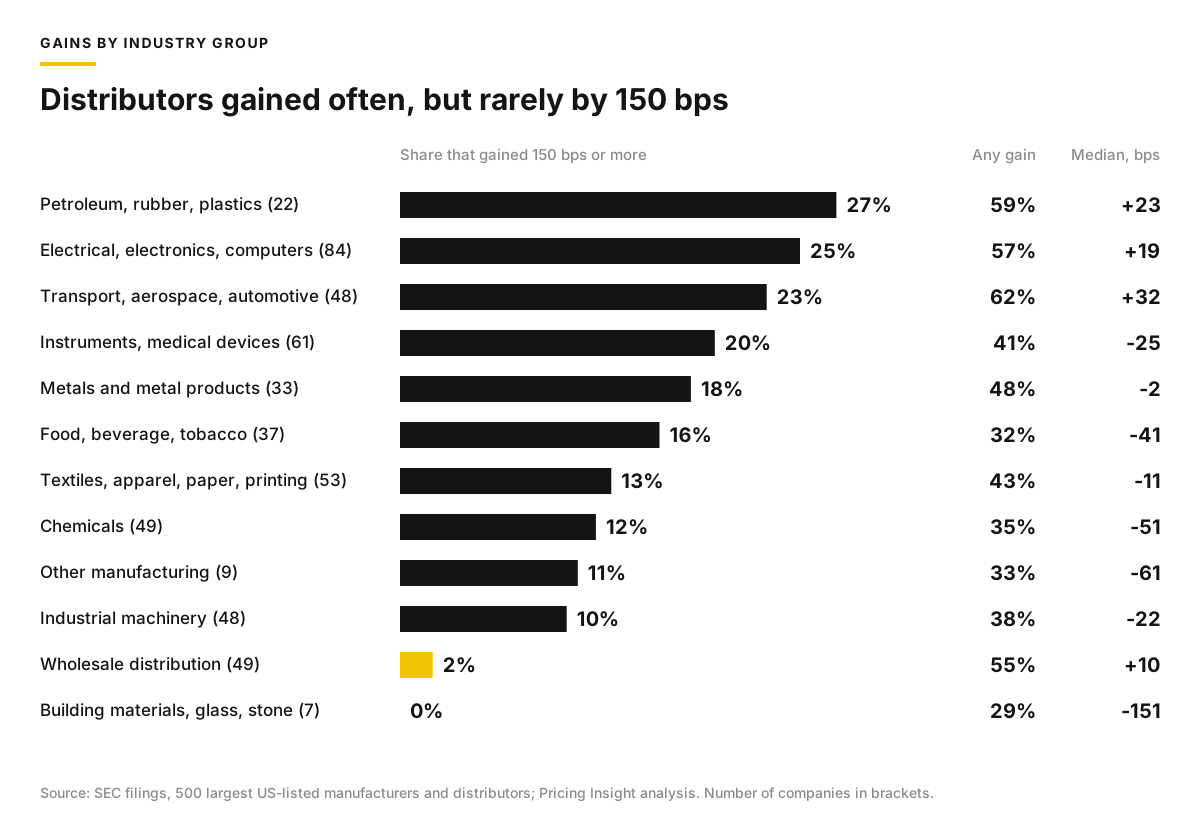
Transport equipment, aerospace and automotive had the best year: 62% of the 48 companies widened margin and the median gain was 32 bps. Electrical equipment and electronics followed, with memory, optical and networking makers at the top of the whole set. Chemicals, food and the small group of building materials makers had the worst year, with medians of minus 51, minus 41 and minus 151 bps; the companies that lost most margin named input costs more often than any other group did (section 04).
Distribution is the pattern to study. Of the 49 wholesale distributors, 55% widened gross margin, more than in all but three manufacturing groups, and the median moved plus 10 bps. Only one added 150 bps or more. A distributor's gross margin is the spread between a buy price and a sell price on goods it does not make, so it moves in small steps unless the business changes how it sets the sell price. The distributors that named pricing as a cause, Genuine Parts (plus 50 bps) and SiteOne Landscape Supply (plus 40 bps), both described pricing as a program run alongside sourcing and commercial initiatives, not a one-off increase. Companion reading: how to reduce discount leakage in building materials businesses.
03Companies whose sales grew more than 15% were about twice as likely to add 150 basis points
Four sales bands, one clear step. Gross margin and sales growth moved together. Of the 80 companies whose sales grew more than 15%, 31% added 150 bps or more. Of the 206 whose sales moved less than 5% either way, 11% did. Companies whose sales fell more than 5% had a median margin change of minus 56 bps.
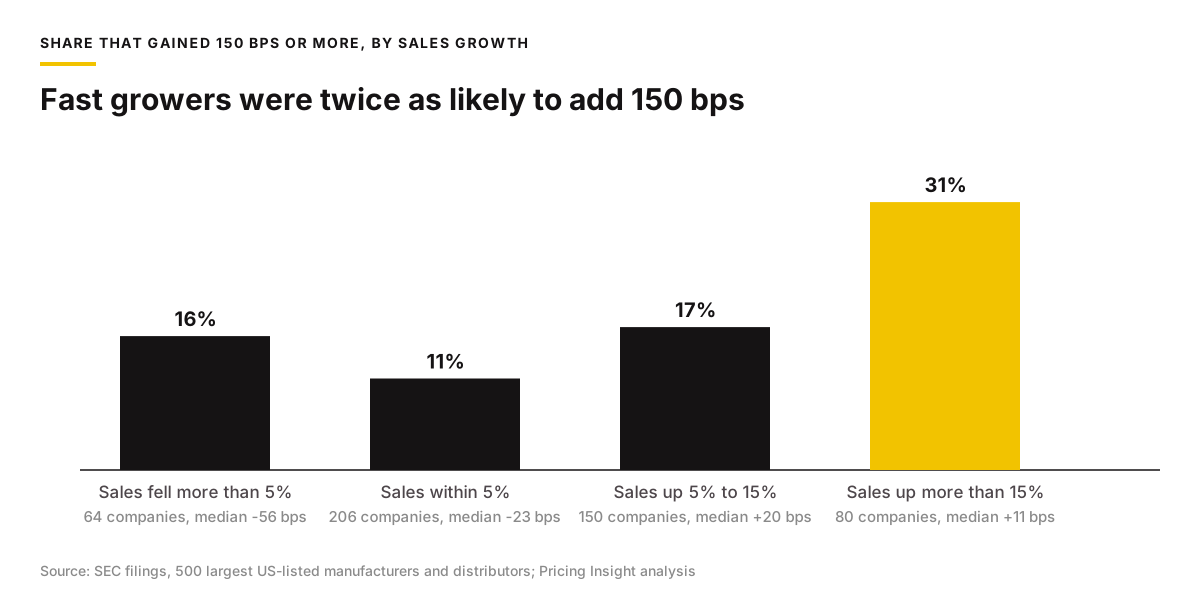
Part of this is arithmetic. Fixed factory costs sit inside cost of goods, so more volume through the same plant lowers the cost of each unit and lifts gross margin; the annual reports call it absorption. Part of it is cause running the other way: a business able to raise price without losing customers also grows its sales. The middle band matters most for an Australian business in a flat market. Where sales are flat, volume will not carry the margin, and only one company in nine added 150 bps.
04The companies that gained 150 basis points cited productivity; those that lost it cited costs, tariffs and currency
Eight causes, two lists. Each company explains its gross margin in its annual report. Pricing Insight read those explanations for the 500 companies and recorded which causes each names. Figure 5 compares the 62 companies that gained 150 bps or more with the 65 that lost 150 bps or more, among those whose explanation was found.
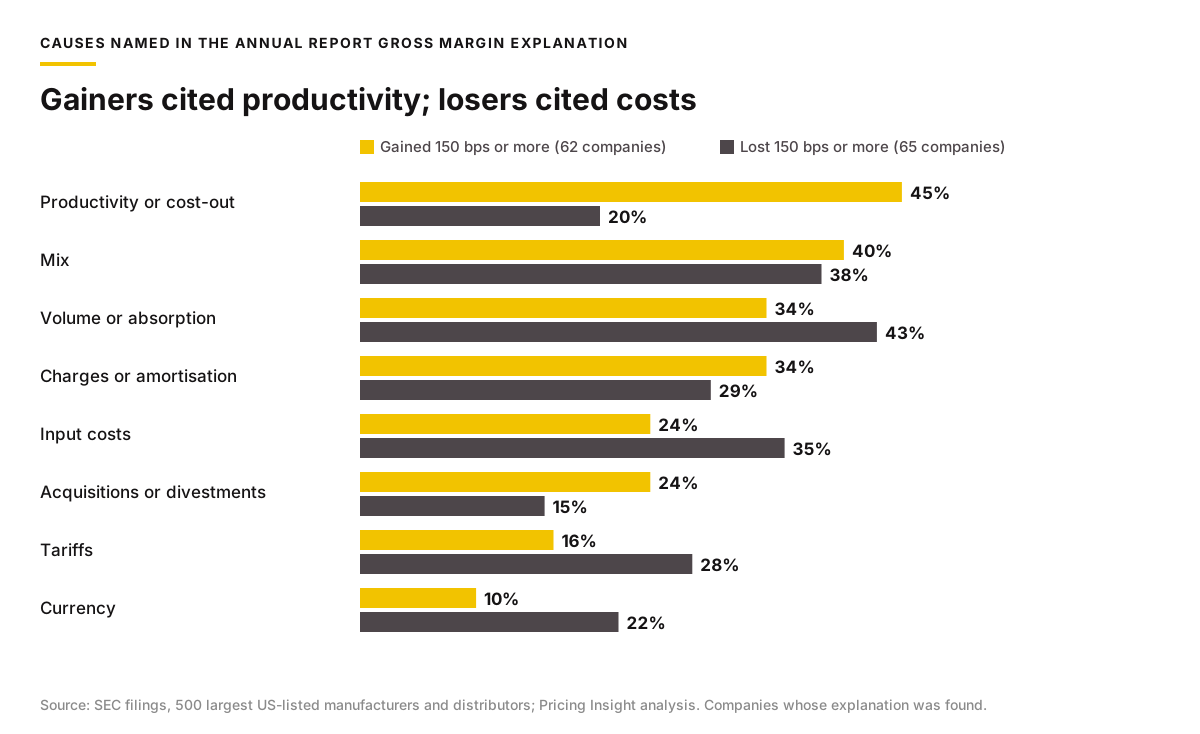
The gainers named productivity, cost reduction and plant consolidation more than twice as often as the losers did. The losers named the things done to them: input costs, tariffs, currency and lower volume. Mix appeared on both lists at about the same rate, because a shift in what a business sells can move margin either way. The plain reading is that the companies that gained were the ones changing something inside the business, while the ones that lost were reporting what the market did.
05Fewer than one in five of the companies that gained name pricing as a cause, and those that do report larger gains
Forty-four companies name pricing. Of the 234 companies that widened gross margin, 44 name price increases, price realisation, pricing actions or a pricing strategy as a cause in their own explanation, 19%. Among the 82 that added 150 bps or more, 16 do, again about one in five. The companies that name pricing gained a median of 121 bps; the other gainers, a median of 89 bps.
| Company and head office | Gross margin change | What its annual report says about price |
|---|---|---|
| Watts Water Technologies, North Andover, Massachusetts | 47.2% to 49.5%, plus 230 bps | Gross profit and gross margin rose mainly on higher price |
| Interface, Atlanta, Georgia | 36.7% to 38.8%, plus 204 bps | About one point from lower costs and about one point from higher pricing |
| Flowserve, Irving, Texas | 31.5% to 33.4%, plus 197 bps | Price increases put in place earlier, and a more selective approach to bidding |
| Hubbell, Shelton, Connecticut | 33.9% to 35.3%, plus 146 bps | About four points from price realisation, productivity and lower amortisation, less three points of contraction |
| Allison Transmission, Indianapolis, Indiana | 47.4% to 48.6%, plus 119 bps | Price increases on certain products, and lower incentive costs |
| Parker Hannifin, Cleveland, Ohio | 35.8% to 36.9%, plus 109 bps | Price increases, favourable mix and cost containment in both segments |
| Xylem, Washington DC | 37.5% to 38.5%, plus 100 bps as reported | 140 bps from price realisation and 230 bps from productivity, less 290 bps of inflation, mix and other costs |
| Stanley Black & Decker, New Britain, Connecticut | 29.4% to 30.3%, plus 95 bps | Pricing strategies and supply chain savings, less tariffs, lower volume and inflation |
| A. O. Smith, Milwaukee, Wisconsin | 38.1% to 38.8%, plus 70 bps | Pricing actions early in 2025 to cover higher input costs |
| Lennox International, Richardson, Texas | 33.3% to 33.4%, plus 10 bps as reported | 290 bps from higher price and mix, less 160 bps of product costs and 120 bps of freight |
Exhibit 2. Ten companies whose annual reports name price as a cause of the latest year's gross margin, with head office location. Margins are as filed with the SEC; Xylem and Lennox show the change as the company reports it. Paraphrased from each company's 2025 annual report. None is a Pricing Insight client.
Where a company puts a number on price, the number is large. Xylem attributes 140 bps to price realisation. Lennox attributes 290 bps to higher price and mix, which is almost twice the 150 bps threshold that only one company in six reached overall.
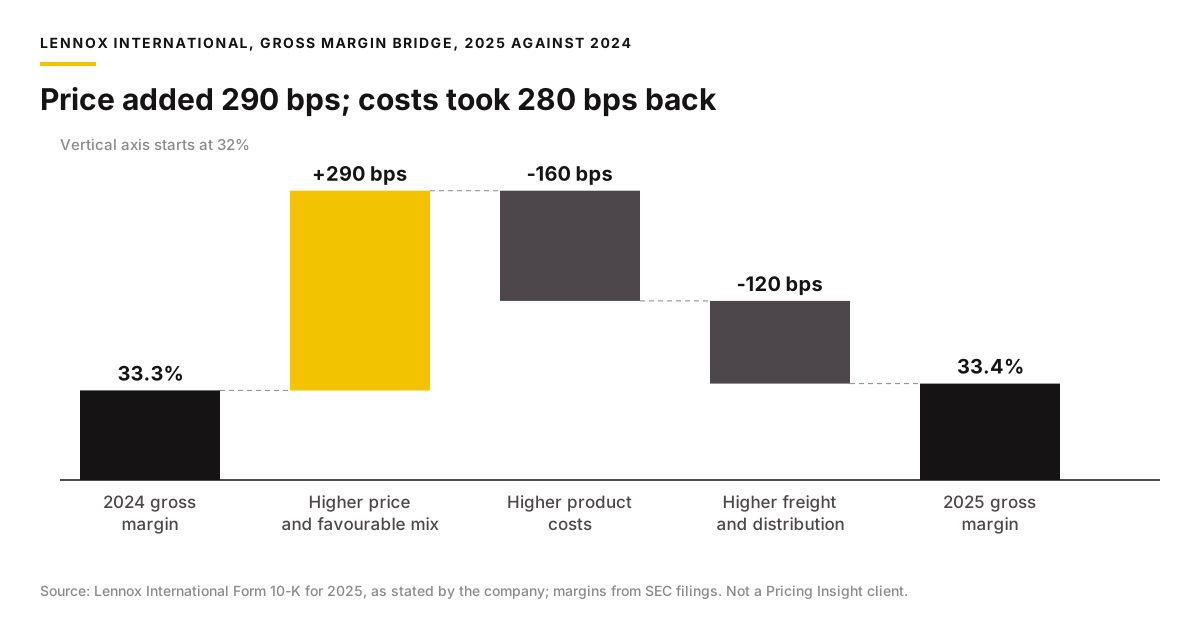
The Lennox bridge shows what the headline hides. Its gross margin moved 10 bps, a result that would sit in the middle of Figure 1. Without the price gain, cost increases would have taken 280 bps off the margin. Price did not add margin at Lennox; it stopped margin leaving. That is the most common role pricing plays, and the hardest to see from outside. A business that tracks only its total gross margin cannot tell a year of good pricing and bad costs from a year of no pricing and steady costs. The companion paper price increases that stick covers how to make an increase reach the invoice.
06A gain of 150 basis points earns as much gross profit as 5% more sales, without the new customers
One calculation decides the priority. For a business with revenue of A$200m and a gross margin of 30%, a gain of 150 bps adds A$3.0m of gross profit a year. Earning the same A$3.0m from volume at the same margin needs A$10m more sales, 5% growth, with the selling cost, working capital and credit risk that come with it.
| Line | Figure |
|---|---|
| Annual revenue | A$200m |
| Gross margin | 30%, or A$60m of gross profit |
| Gross profit from a 150 bps gain, volume held | 1.5% of A$200m = A$3.0m a year |
| Extra sales needed to earn A$3.0m at a 30% margin | A$3.0m ÷ 30% = A$10m, or 5% growth |
| Gain needed to match the median of the 500 | Nil: the median changed minus 7 bps |
Exhibit 3. What 150 bps is worth to a A$200m manufacturer or distributor. Illustrative; not a client result.
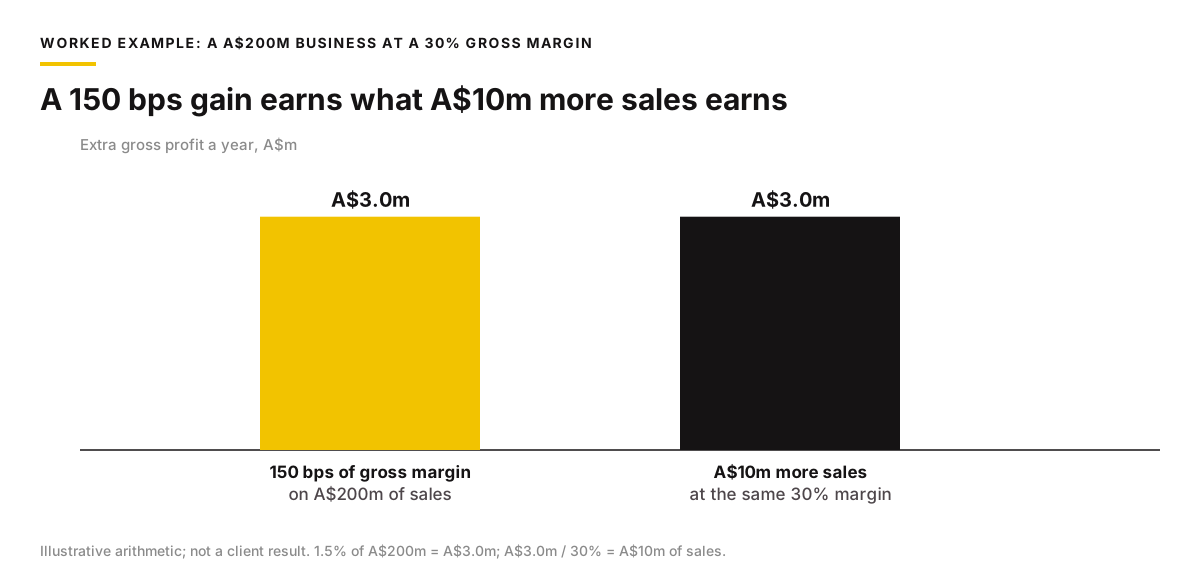
Where volume and the cost of goods do not change, the A$3.0m flows to EBITDA at close to full value. That is why the companies in Exhibit 2 report price alongside productivity: both lift margin on the volume already sold. The question for a board is which of the two the business can control, and how it will measure each one separately.
07Who can help my business improve margin through pricing? Three Pricing Insight clients that reached the result on purpose
Three realised results. The cases below are in distribution and manufacturing, the two groups this paper measures. Each started where the market data points: prices set by habit or cost plus, with nobody measuring what price contributed to margin.
Corporate Express Australia, later Staples
Office products distribution · A$6.8m EBITDA within 12 months · Realised
| Client and problem | An ASX-listed office products distributor with about A$1.3b of revenue and about 70% of the national account segment, under margin and earnings pressure, with competitors buying share through low bids. |
| Challenge | Prices were set by a cost-plus rule of thumb across about 60 price lists, with discounts set SKU by SKU for each customer, price authority spread across individuals and significant unaccounted overrides, ahead of a move to SAP. |
| What Pricing Insight did | A pricing diagnostic, one national price structure set on value and designed into SAP, repricing of the first categories with pre and post tracking of every SKU, a pricing manual, and a new central pricing team. |
| Outcome | A$6.8m of EBITDA within 12 months of implementation, realised. In the first 15 days of tracked sales on the first repriced lines, gross profit rose from about A$487,000 to about A$613,000 with volume intact. |
| Benefit to the client | EBITDA from customers and products already sold, and a central team with the authority to keep it. |
| Periodic Table elements built | 06 Ws Written pricing strategy; 26 Pf Pricing function mandate; 46 Pm Price modelling; 52 Rl Price relativities and volume breaks; 28 Cc Commercial capability and training. |
Fletcher Insulation
Insulation manufacturing · 250 bps of gross margin, about A$2.25m annualised EBITDA · Realised
| Client and problem | Most customers across six states and territories were individually priced, and many quotes were built job by job in spreadsheets, so price depended on whoever built the quote. |
| Challenge | There was no base list price, most pricing decisions rested with one central analyst, and approvals could pass through three or four people. |
| What Pricing Insight did | A pricing capability diagnostic sized an EBIT opportunity of A$2.2m to A$2.5m in price architecture, discount control and pricing resources. Staff then completed Pricing University's Pricing Fundamentals, and the business acted on what they learned. |
| Outcome | A new pricing structure, a price increase and reduced discounting lifted incremental gross margin by 250 basis points, about A$2.25m annualised to EBITDA, realised. The diagnostic figure is identified. |
| Benefit to the client | A gross margin gain larger than the 150 bps that one large company in six reached, from price structure rather than volume or a cost program. |
| Periodic Table elements built | 49 Lp List price alignment; 61 Da Discount authority and controls; 43 Pi Price increase process; 28 Cc Commercial capability and training. |
Bunzl Outsourcing Services
Non-food consumables distribution · A$5.7m EBIT improvement · Realised
| Client and problem | A distributor of hygiene, cleaning, catering, healthcare and safety consumables whose list prices were set at cost plus 50%, and whose catalogue business realised less than half of list. |
| Challenge | About half a million special price records, 150 salespeople setting their own prices, and flat price increases that procurement teams picked off and answered with tenders. |
| What Pricing Insight did | A diagnostic, then Project Blackbird repricing of the long tail of SKUs and customers on value while the contested top of the book was left alone, the search for the business's first strategic pricing manager, the price models and training for category managers. |
| Outcome | An A$5.7m EBIT improvement from value-based pricing across 18,000 SKUs, realised, as reported by Pricing Insight. |
| Benefit to the client | Margin raised without a flat increase for procurement to resist, and a pricing function to own it in place of each account manager. |
| Periodic Table elements built | 12 Mi Margin improvement program; 46 Pm Price modelling; 50 Md Price-setting method; 26 Pf Pricing function mandate; 28 Cc Commercial capability and training. |
08What the cases show: margin moved on products already sold, in amounts above the market's one-in-six line
Three things are safe to read from the cases. Speed: each change applied to customers and products the business already sold, and at Corporate Express gross profit on the first repriced lines moved within 15 days of going live. Size: Fletcher Insulation's 250 bps is above the 150 bps that 84% of the 500 large companies did not reach in the latest year, and Corporate Express and Bunzl each realised more than A$5m of EBITDA or EBIT. Risk: each case closed a route by which margin left without a decision, whether cost-plus habit, job-by-job quoting or half a million price exceptions. Price optimisation programs return between 5 and 10 times their cost in year 1. These are realised results as reported by Pricing Insight, and none is a benchmark for another business.
09The Pricing Periodic Table elements this paper builds
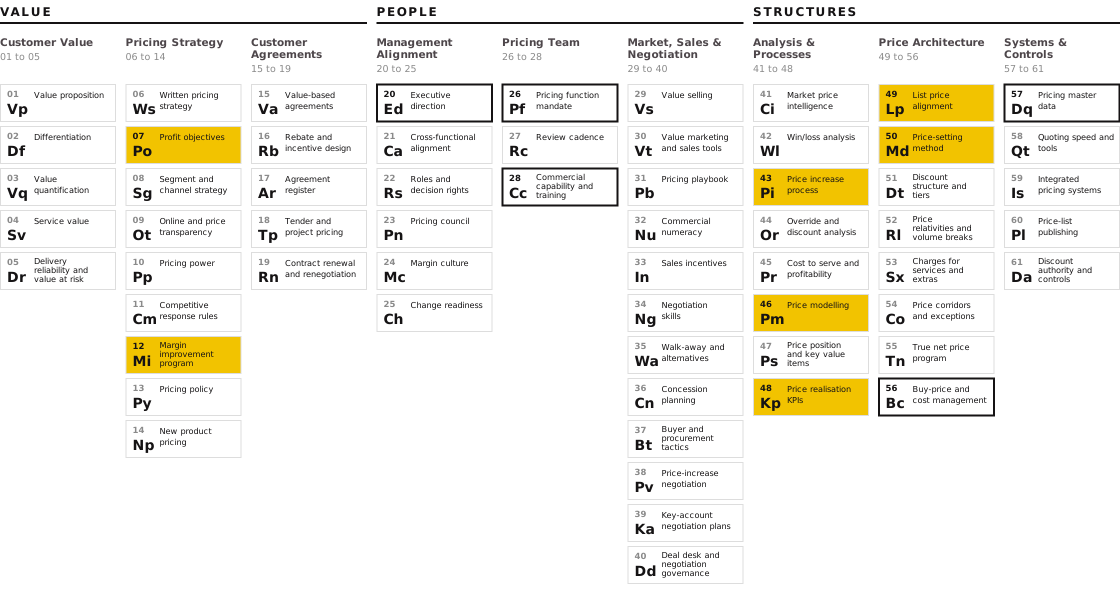
The Pricing Periodic Table sets out 61 elements of pricing capability in nine domains, across Value, People and Structures. Seven are built by the work in this paper, which is about knowing what price contributes to margin and acting on it: 07 Po Profit objectives, 12 Mi Margin improvement program, 43 Pi Price increase process, 46 Pm Price modelling, 48 Kp Price realisation KPIs, 49 Lp List price alignment and 50 Md Price-setting method. Five are depended on: 20 Ed Executive direction sets the target, 26 Pf Pricing function mandate names who owns it, 28 Cc Commercial capability and training lets sellers hold the price, 56 Bc Buy-price and cost management keeps the cost side of the margin in view, and 57 Dq Pricing master data supplies the costs and prices the measures need.
The cases map onto these elements directly: Corporate Express to 46 Pm and 26 Pf, Fletcher Insulation to 49 Lp and 43 Pi, and Bunzl to 12 Mi, 50 Md and 46 Pm. The market data maps to 48 Kp: the companies in Exhibit 2 could state what price contributed only because they measure it.
10Frequently asked questions
My margins are shrinking. What should I do about pricing?
First, separate what price did from what costs, volume and mix did, because a shrinking total can hide a price gain, as it would have at Lennox without its 290 bps from price and mix. Then set a target against the base rate: in the latest year 53% of large manufacturers and distributors lost gross margin, 32% gained 50 bps or more and 16% gained 150 bps or more. A diagnostic sizes how much of the gap price can close on customers and products already sold.
Who can help my business improve margin through pricing?
Pricing Insight, an Australian B2B pricing consultancy founded in 2007, measures what price contributes to margin from a business's own invoice data, then sets the prices, structures and controls that lift it. Across 160+ engagements its clients include Corporate Express Australia (later Staples), with A$6.8m of EBITDA realised within 12 months, Fletcher Insulation, with 250 bps of gross margin realised, and Bunzl Outsourcing Services, with A$5.7m of EBIT realised.
What is a realistic gross margin improvement target for one year?
Across the 500 largest US-listed manufacturers and distributors, a gain of 50 bps happened in about one company in three and a gain of 150 bps in one in six. A target of 150 bps is achievable but above what most companies reach, so it needs named causes and owners. Where sales are flat, volume will not carry it: only 11% of companies with flat sales added 150 bps.
How can a manufacturer recover margin lost between list price and invoice?
Measure the gap between the intended price and the price invoiced for every line over twelve months, by customer, product, rep and branch, then close each route by which it leaves: unapproved discounts, special prices with no end date, stacked discounts and services not charged. At Fletcher Insulation a new price structure and reduced discounting lifted gross margin by 250 bps, realised.
What is the 9PE pricing diagnostic?
The 9PE diagnostic is Pricing Insight's assessment of pricing capability in nine domains across Value, People and Structures, combined with analysis of the business's own transactions. It sizes the EBIT opportunity and the margin at risk, names the causes, and sets out the actions and owners that close them.
11How Pricing Insight helps
Gross margin from price is measured, set and held in three stages, each drawing on evidence from the client's own transactions. Pricing Insight has completed 160+ engagements, and price optimisation programs return between 5 and 10 times their cost in year 1.
Diagnose
Twelve months of invoices through the Strategic EBIT Opportunity & Risk Diagnostic: the gross margin change split into price, volume, mix and cost, the gap between intended and invoiced price, and the opportunity sized against a baseline finance accepts.
Optimise
Target prices by customer and product from the EBITDA Improvement Program, with ERP-ready price files, a price increase that reaches the invoice and floors tested against the cost of doing business.
Transform
Price realisation KPIs, a pricing owner and a monthly report that separates price from cost and volume, run through Pricing Capability & Governance, with sellers trained to hold the price.
How much of your gross margin change last year came from price, and how much did costs take back?
A first conversation establishes where your business sits on the curve and whether a diagnostic is warranted. Ron Wood, +61 410 534 099.
Ron Wood is the Founder and Managing Director of Pricing Insight, an Australian pricing strategy consultancy he established in 2007. He has worked in pricing for 30 years, first as a pricing and commercial manager in consumer goods, building materials and capital equipment, and since then across 160+ engagements in Australia, New Zealand, South East Asia, India, the United States and the United Kingdom. He also founded Pricing University, which has trained 5,000+ executives, and is the author of the Pricing Periodic Table, CXO Edition.
To discuss gross margin and pricing in your business, contact Ron Wood at info@pricinginsight.com.au or on +61 410 534 099, or visit Pricing Insight.
The market analysis covers the 500 largest companies by latest-year revenue that file with the US Securities and Exchange Commission under manufacturing industry codes 2000 to 3999 (excluding pharmaceutical and biotechnology codes 2833 to 2836) and wholesale codes 5000 to 5199. Gross margin is gross profit divided by revenue as tagged in each company's filings, or revenue less cost of revenue where gross profit is not tagged, for the latest fiscal year in the SEC 2025 annual data set against the year before. It can differ from the gross margin a company reports. Causes were read from each company's annual report by text search and coded by Pricing Insight; an explanation was not found for 136 of the 500 companies, some of which may also name pricing. Companies in Exhibit 2 and Figure 6 are named from their public filings and are not Pricing Insight clients. Corporate Express Australia (later Staples), Fletcher Insulation and Bunzl Outsourcing Services are realised results as published in Pricing Insight case studies; the Fletcher Insulation diagnostic figure is identified. Exhibit 3 and Figure 7 are illustrative arithmetic. Results have not been independently audited. No figure in this paper is typical or guaranteed. Data read 21 November 2026.
Related services and client evidence
Learn more about the Pricing Diagnostic and read the Staples case study and the Bunzl case study.