
White paper · Optimise · 21 min read
Sources: Fletcher Insulation and Tradelink case studies published on pricinginsight.com; the building-materials group result is from the Pricing Periodic Table, CXO Edition, which notes that other price moves in the period were not separated out. Fletcher Insulation and the building-materials group are realised results as reported by Pricing Insight, not independently audited; Tradelink is an identified opportunity. None is a benchmark for another business.
Discount leakage is margin a building materials business has already set in its prices and then gives away without anyone deciding to. It leaves at the trade counter, in the quote, through project prices that outlive the job, through tiers no customer’s spend supports, and through freight and cutting that never reach the invoice. Because the customers, products and volume are already in place, recovering it needs no new customer, product or cost program.
The question this paper answers
How do I measure price leakage in a building materials business, and how do I reduce the discounts that leave at the counter, in the quote and on the project price without a decision?
Key takeaways
- Discount leakage is the gap between the price the business intended and the price it was paid, where nobody approved the gap or the condition behind it was never met.
- Twelve months of invoices is enough to measure it, reported by customer, product, rep and branch.
- Six controls reduce it: authority bands on every quoting path, an end date on every special and project price, a reason code on every override, one discount rule applied once, tiers earned on spend, and services and freight on the invoice.
- Recovered price flows to EBITDA at close to full value, because volume and the cost of goods do not change.
Five Pricing Insight clients in building materials show what this is worth: Stramit, Laminex, Tradelink, Fletcher Insulation and a cabinet and architectural hardware distributor, each in the same six-part form and each labelled realised, identified or projected.
01Discount leakage in building materials is margin given away without a decision, and it is already inside the revenue
Seven routes. A discount is a decision to sell below the intended price in return for something: a builder’s volume, a merchant’s range, a project won. Leakage is what happens when the decision is missing: nobody approved the price, the project has finished, or the volume never came. Building materials carries more routes than most: branches, trade counters, merchants, builders, project desks, cut-to-size lines and freight on most jobs.
| Route | What it looks like in building materials | Where it shows |
|---|---|---|
| Unapproved discounts | A price loaded on request, or a quote raised in a system that skips approval | Invoice price below system price with no approval record |
| Discounts that outlive their reason | A builder or project rate that has become a merchant’s standard rate | Discounts with no review date, unchanged for years |
| Special prices with no expiry | A project price still live after the job, used on later orders | Special prices with no end date, or past it and still invoiced |
| Overrides at the counter or in the quote | A counter price dropped on a customer’s claim, with no quote sighted | Override share by rep, branch and customer |
| Discount stacking | A trade tier, a local matrix, a promotion, a rebate and free freight on one sale | Net price after every deduction |
| Discounts for volume never bought | A builder on a volume tier who now orders one pack | Discount level against twelve-month spend |
| Services given away | Freight, cut-to-size work, take-offs and urgent delivery not charged | Freight and service recovery against cost |
Exhibit 1. Seven routes by which discount margin leaves a building materials business without a decision. Source: Pricing Periodic Table, CXO Edition, chapters 3, 8 and 10, and Pricing Insight diagnostic work in building materials.
Each route needs a rule, an owner and a report, not a new strategy. Companion reading: the pocket price margin waterfall and discount KPIs and controls.
02How do I measure price leakage in my business? Start with twelve months of invoices
Four cuts of one invoice file. Measurement needs no new system. For each invoice line over twelve months, record the price the business intended (the system price, the list less the customer’s standard discount, or the agreed contract or project price), the price invoiced, any later credit, the freight and services delivered, and the cost of the goods. The gap between intended and invoiced price is the discount actually given. Tag each gap with its route from Exhibit 1. A diagnostic scoped for a building products distributor with more than 25,000 products and cut-to-size services tests five disciplines this way: discount to win, overrides, discount expiry, stacking and price matching.
| Report the gap by | What a cluster usually means | Who fixes it |
|---|---|---|
| Customer | An agreement, tier or project price that no longer matches what the builder or merchant buys | Account owner, at the next renewal |
| Product | A list price or price band out of line with the market, so sellers discount to reach it | Pricing manager |
| Rep | An authority level set too wide, or a seller who needs coaching on what a discount costs | Sales manager |
| Branch | Counter practice: the same product priced differently for the same type of customer | Branch or state manager |
Exhibit 2. Four cuts of the discount gap, and who fixes each. Adapted from Figure 9.4, Pricing Periodic Table, CXO Edition.
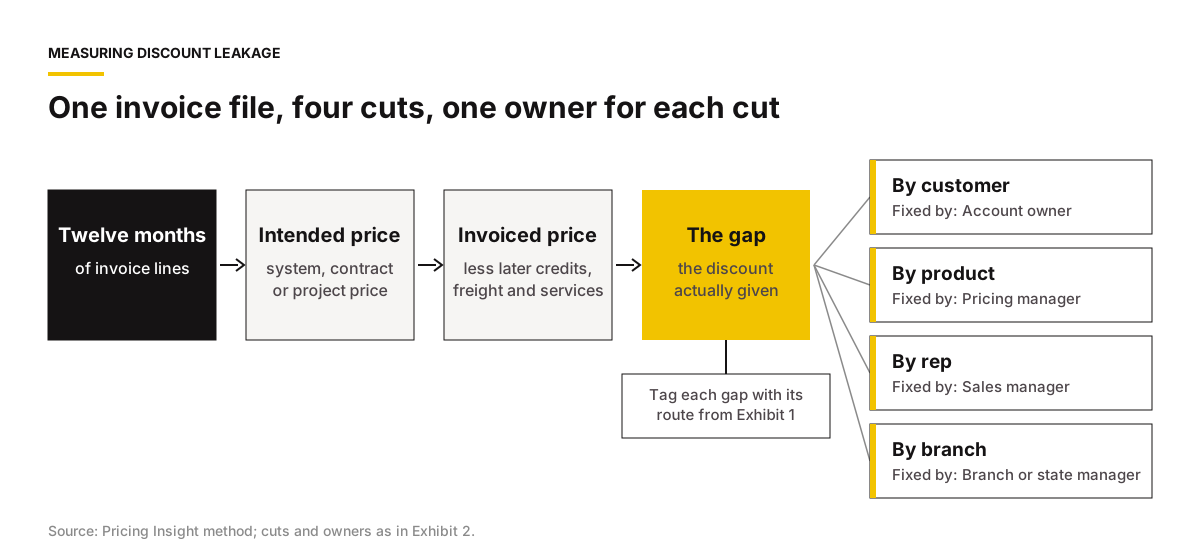
Five measures turn the file into a monthly report: the share of revenue invoiced at list or system price in the three largest categories; revenue on exception prices, with the age of each and the margin given below target; override share by rep against a stated limit, such as the 10 per cent of gross sales one joinery hardware distributor proposed; the count of special and project prices with no end date or past it; and freight and service recovery against cost.
Branch and product comparison usually shows the gap fastest. In one timber group, one branch needed only a 16 per cent margin on framing pine and another in the same state needed 32 per cent, and the same builder could buy from both a day apart. At an Australian maker of plastic pipe, pipe at the same price per tonne and a similar diameter could carry margins more than 10 points apart; the diagnostic projected about A$5.6m a year of operating profit from better prices and an increase program. See also fixing inconsistent customer discounts in multi-branch distributors.
A worked example
| Line in the review | Figure |
|---|---|
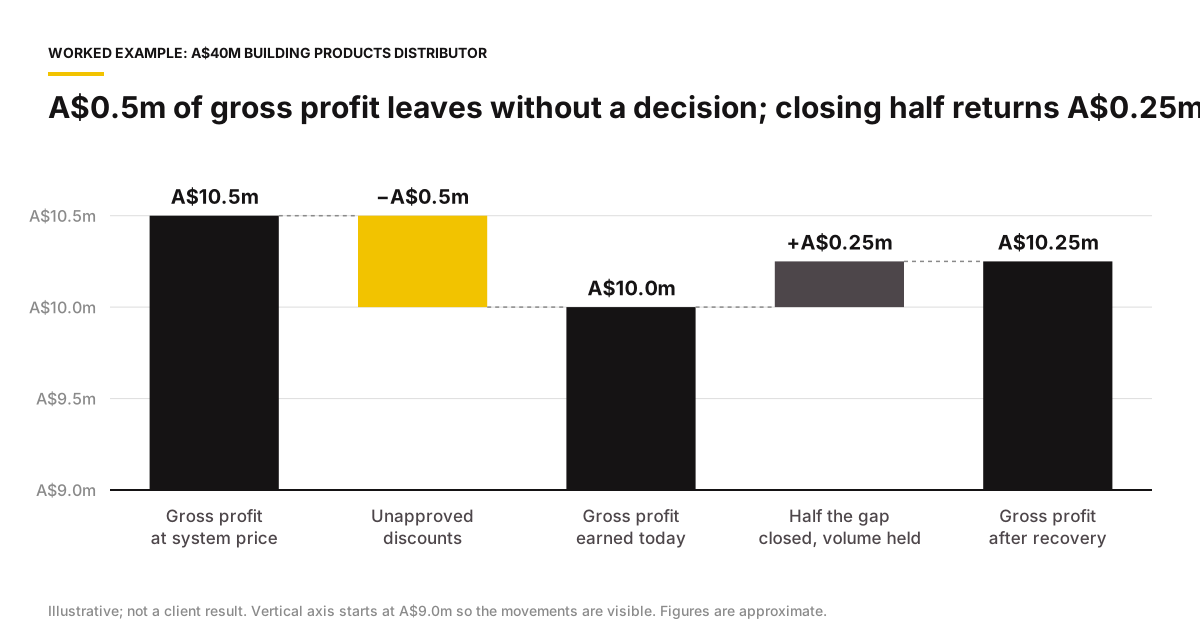
| Annual revenue, building products distributor | A$40m |
| Gross margin | 25 per cent, or A$10m of gross profit |
| Revenue invoiced below system price with no approval record, mostly counter and quote overrides | A$8m, an average of 6 per cent below system price |
| Revenue on those lines at system price | About A$8.5m |
| Gross profit given away without a decision | About A$0.5m a year, 5 per cent of gross profit |
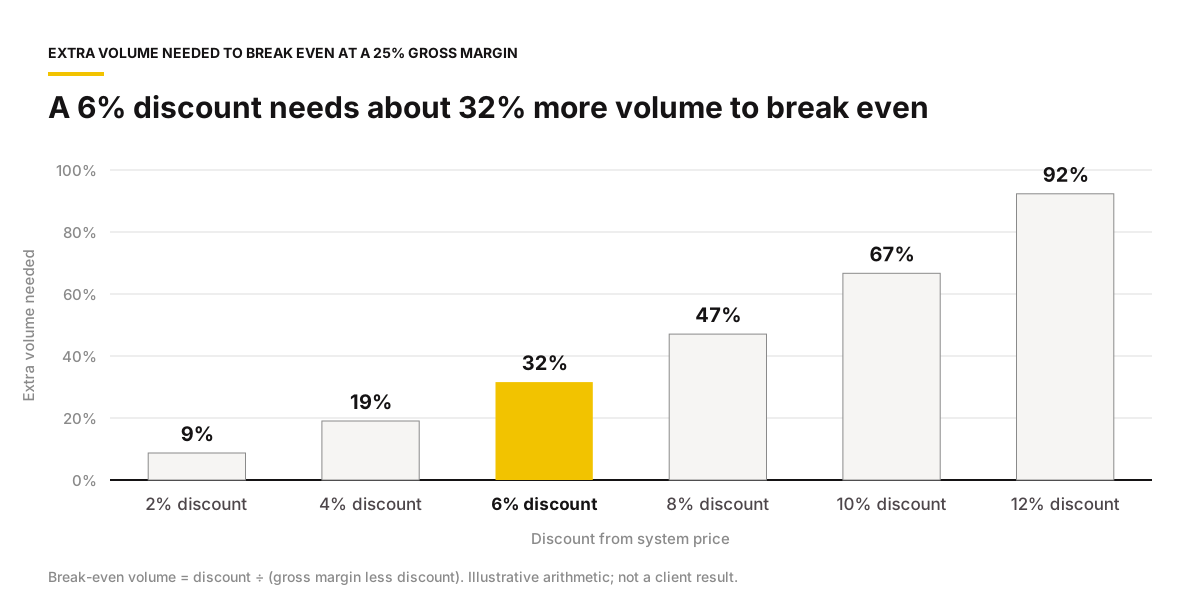
| Extra volume a 6 per cent discount needs at a 25 per cent margin to break even | About 32 per cent |
| Gross profit recovered if half the gap is closed, volume held | About A$0.25m a year |
Exhibit 3. Sizing unapproved discounts in a building products distributor. Illustrative; not a client result. Break-even volume is the discount divided by the gross margin less the discount: 6 ÷ (25 less 6) = about 32 per cent.
With the same goods and volume, every dollar of price recovered is close to a dollar of EBITDA. Unless the customers who received those discounts bought about 32 per cent more, the discounts did not pay for themselves.
03Authority bands, enforced on every quoting path, stop discounts given without approval
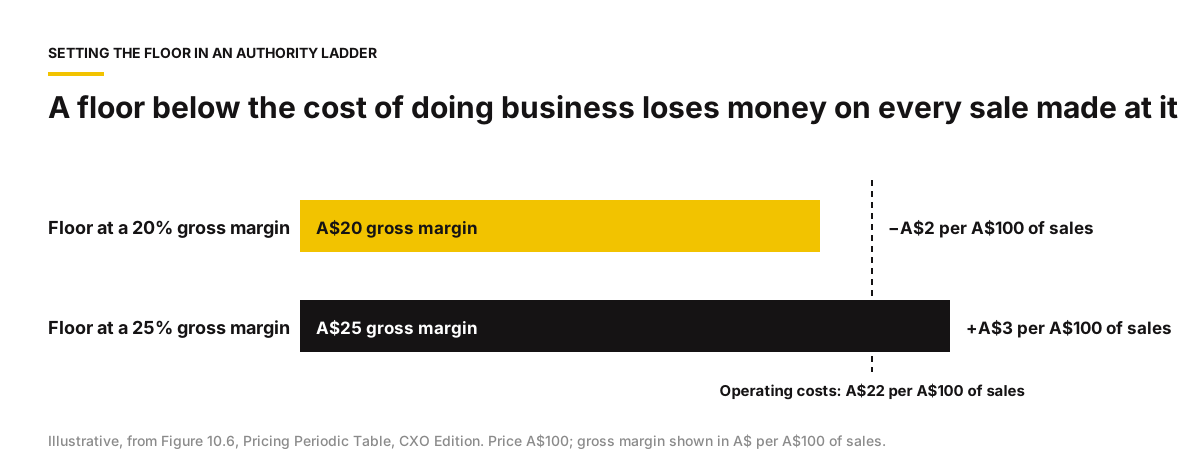
Four bands, each with a named owner. Discount authority groups discounts into margin bands and names the role that approves each. It is set in the system, so it applies at quote and order entry, and every override carries a reason code. Prices inside the band need no approval, which keeps routine counter orders fast.
| Price | Approved by |
|---|---|
| Inside the band, or above target | Sales rep or counter staff |
| Up to 2 points below the floor | Branch or sales manager |
| 2 to 5 points below the floor | Sales director with the pricing manager |
| More than 5 points below the floor | CFO or deal desk, with a written case |
Exhibit 4. The authority ladder. Illustrative, from Figure 10.6, Pricing Periodic Table, CXO Edition. At a price of A$100, a floor at a 20 per cent margin and operating costs of A$22 per A$100 of sales, a sale at the floor loses A$2; at a 25 per cent floor it earns A$3.
Limits fail in two directions. Too tight, they bury managers in routine requests; set on one system and not another, they push volume to the path with no control. List every way a price can be loaded on request, changed after approval, quoted in an older system or overridden at the counter, and close each one. At Allegion, a door hardware maker, a staff member put it plainly: “some people just ask for a price to be changed and it happens. No financial rationale or approvals needed.” Test the lowest band against the full cost of doing business.
Stramit
Steel roll-forming · A$4m to A$7.5m annual EBIT opportunity · Identified
| Client and problem | Base prices sat above market, so special pricing agreements had become the routine way to reach a market rate: “SPA’s have become the norm rather than offering customer wide rates,” a staff member wrote. Freight was often not charged, or charged inconsistently. |
| Challenge | A new pricing system sent any move of half a per cent for approval, so managers faced hundreds of requests a week, while quotes raised in the old system skipped approval altogether. Raising a customer’s price needed more approval levels than cutting it. |
| What Pricing Insight did | A pricing diagnostic across the nine domains of pricing capability, playbooks, override limits and pricing maths training. It recommended limits by deal size and product class, closing the unapproved route, and a Pricing Council to own the limits. |
| Outcome | An A$4m to A$7.5m annual EBIT opportunity identified, as published. Identified, not realised. |
| Benefit to the client | Margin loss sized in annual EBIT against named causes, with limits that speed routine quotes and stop the ones that give margin away. |
| Periodic Table elements built | 61 Da Discount authority and controls; 23 Pn Pricing council; 53 Sx Charges for services and extras; 57 Dq Pricing master data. |
04An end date on every special and project price stops discounts outliving the job they were set for
Three kinds of contract price, three end dates. A special price is agreed for a project, a tender or a builder’s program. Once loaded, it stays live after the job, is used on later orders and misses each annual increase. Allegion staff described one form of it: “Builder pricing agreements which have become standard merchant pricing.” At the cabinet and architectural hardware distributor in section 07, about 64,000 tender lines in one state’s architectural hardware business had no sales in twelve months, and each was still a live price a customer could call on.
| Kind | Conditions | End date |
|---|---|---|
| Key account, merchant or builder contract | Volume, range | At term, reviewed yearly |
| Tender or project price | Scope tendered, project number, quantity | 12 months |
| Short project price | Reason code | 3 to 6 months |
Exhibit 5. Every contract price is one of three kinds, and each has an end date. Source: Figure 3.4, Pricing Periodic Table, CXO Edition.
One route for every price below the customer’s normal level closes the gap. The request states what the business gets in return. The price is approved at the level that matches the cut, loaded with a reason code, project number, quantity and end date, and reviewed at twelve months: if the customer delivered, it becomes a standard discount; if not, it is removed. Keep one register of every special price, visible on the quoting screen. Stramit staff described the alternative: “We rely on our customers to tell us an agreement number. If they don’t, we overcharge, resulting in a credit.”
Laminex
Decorative panels and laminates · A$6m to A$10m EBIT uplift · Identified
| Client and problem | The trade price book sat well above the market, so reps discounted heavily to reach a market price, and “the discount groups have not been reviewed for more than 4 years,” a staff member wrote. |
| Challenge | Project prices ran on spreadsheets outside the main system, two reps could quote the same project without knowing, and one project price in place since 2014 was “effectively missing 6 annual price increases”. Nothing flagged a price for review when a customer’s sales did not increase. |
| What Pricing Insight did | A pricing diagnostic across the nine domains, with work on pricing structure, discount governance and commercial capability. It recommended a project register in the main system with end dates and review triggers, and tiers tied to spend and region. |
| Outcome | An A$6m to A$10m EBIT uplift identified, as published. Identified, not realised. |
| Benefit to the client | Out-of-date tiers and project prices that missed increases, sized and closed by an end date and a register rather than more approvals. |
| Periodic Table elements built | 17 Ar Agreement register; 18 Tp Tender and project pricing; 54 Co Price corridors and exceptions; 51 Dt Discount structure and tiers. |
05A reason code on every counter and quote override separates the overrides that win work from those that repeat an old concession
Three questions for every override. An override is any sale below the system or agreed price, keyed at the counter or written into a quote. Some win profitable work; others repeat a concession nobody would approve if asked. A reason code separates the two. The monthly report shows where overrides cluster, what each cluster cost and whether the same reason keeps returning, and each cluster goes to the person in Exhibit 2 who fixes it. Where overrides cluster on one product line, fix the band rather than issue more exceptions.
Mitre 10 staff described what an unbounded price guarantee does: “there are times where our customer uses the price guarantee, and our products are sold below cost.” Mitre 10’s more than A$10m margin opportunity is identified, not realised.
Tradelink
Plumbing supplies distribution · 200+ branches · A$10.8m annualised margin opportunity · Identified
| Client and problem | Staff did not trust the price book, so branches and reps overrode and contract-priced around it, and counters dropped prices on hot water units, PVC fittings and copper on customer claims without asking to see the quote. |
| Challenge | Override reports reached managers each morning, and one staff member’s response was “then what?”. Rebates sat behind invoice cost, so some special quotes went out at nil invoice margin, and delegated authority was “not understood company wide”. |
| What Pricing Insight did | A pricing diagnostic across the branch network, then work to replace overrides with structure and sales enablement: a quote or invoice before any match, an index of the lines customers compare, and a grid for when to match and when to walk away. |
| Outcome | An A$10.8m annualised margin opportunity identified, as published. Identified, not realised. |
| Benefit to the client | Overrides reported daily but not acted on replaced by sized causes and owners, with less exposure to counter matches on unproven claims. |
| Periodic Table elements built | 44 Or Override and discount analysis; 49 Lp List price alignment; 41 Ci Market price intelligence; 61 Da Discount authority and controls. |
Where there is no base list and quotes are built job by job, every quote is in effect an override. Fixing that at Fletcher Insulation produced a realised result.
Fletcher Insulation
Insulation manufacturing · 250 bps of gross margin, about A$2.25m annualised EBITDA · Realised
| Client and problem | Most customers across six states and territories were individually priced, and many quotes were built job by job in spreadsheets, so price depended on whoever built the quote. |
| Challenge | There was no base list price, most pricing decisions rested with one central analyst, and approvals could pass through three or four people. A staff member said: “We don’t have a retail price list, which is really Sales 1.01.” |
| What Pricing Insight did | A pricing capability diagnostic sized an EBIT opportunity of A$2.2m to A$2.5m in price architecture, discount control and pricing resources. Staff then completed Pricing University’s Pricing Fundamentals, and the business acted on what they learned. |
| Outcome | A new pricing structure, a price increase and reduced discounting lifted incremental gross margin by 250 basis points, about A$2.25m annualised to EBITDA, realised as recorded from the engagement. The diagnostic figure is identified. |
| Benefit to the client | Margin that flowed to EBITDA without a new product or a cost program, and a list that replaced job-by-job quoting as the reference sellers discount from. |
| Periodic Table elements built | 49 Lp List price alignment; 61 Da Discount authority and controls; 43 Pi Price increase process; 28 Cc Commercial capability and training. |
06Discount stacking stops when each discount is set once and every sale is judged on net price, with freight and cutting on the invoice
One discount, applied once. Stacking happens when separate discounts fall on one sale and nobody adds them up. Each may be approved on its own, and the seller usually sees only the first.
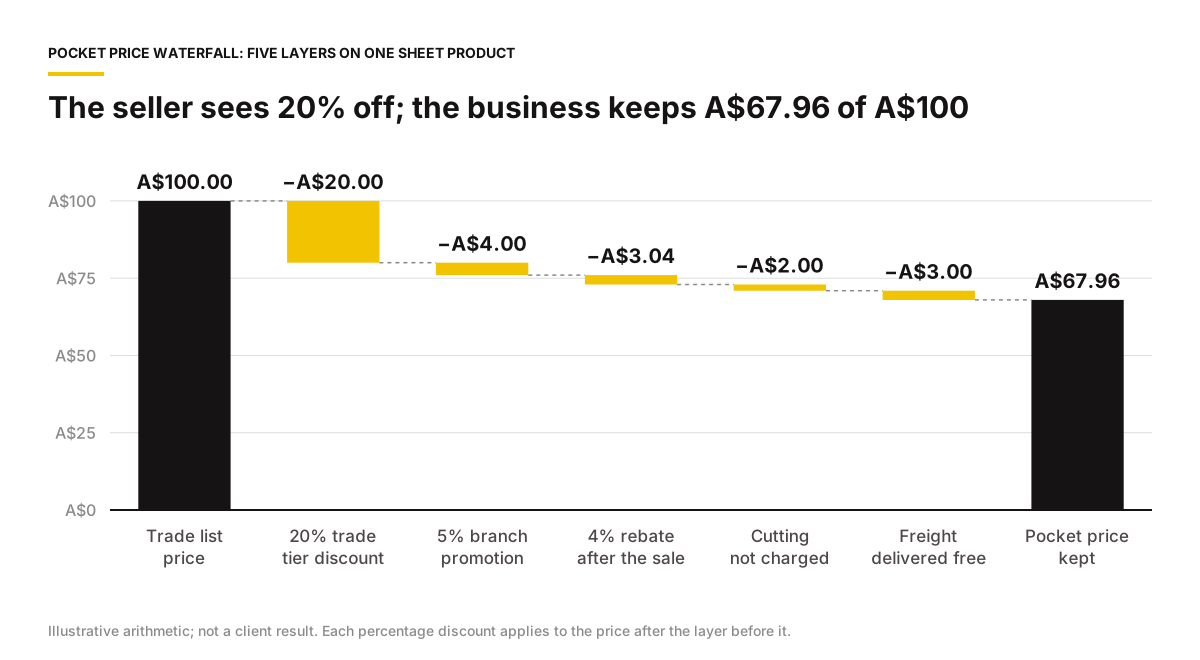
Two rules stop it. First, every product sits in one place in a product tree and every customer in one place in a customer tree; a discount is set at one level of the product tree, such as “ceiling batts”, and applied at one level of the customer tree, such as a builder group, so a second rule cannot add to the first. Mitre 10 staff described about 80 national trade matrices, with stores layering local matrices on top. Second, judge every deal on net price after every discount, rebate, credit and unrecovered service, shown on the quoting screen. Rebate design itself is covered in the companion paper redesigning customer rebates and trade discounts in building materials.
Freight and services are the quietest layers. At Stramit, “A number of invoices don’t get charged at all,” and “freight is freight, but we have 20 different codes.” A building-products manufacturer that described itself with “pipe is pipe” was giving away cut-to-length insulation, engineering take-offs and premium delivery; the diagnostic projected 100 to 200 basis points of margin as recoverable from a priced service list. At InfraBuild Reinforcing, estimating, scheduling and logistics were not separated from the price of bar and mesh; its A$7m to A$10m margin potential is identified. Freight is covered in recovering freight and delivery costs from B2B customers.
07Tiers earned on twelve months of spend, and checked every year, stop discounts for volume never bought
Earned, then checked. A volume tier or builder rate is a price given in advance for volume promised. If the volume never comes, the discount stays unless someone takes it away. A timber salesperson gave a customer volume pricing for large projects; “today the customer ordered just one pack.” Counter staff at one timber and building-products distributor described cash buyers on the trade rate and part packs sold at pack rates.
Four rules keep discounts earned. Set each tier from the last twelve months of spend in the product group. Re-tier every account each year and tell each customer why. Give every volume and builder price a review date and a trigger, so a missed volume moves the price to the tier the spend supports. And make no customer pay more than the published trade-counter price, so the walk-up rate is the ceiling the tiers discount from. Fixed-price contracts change at their end date, the moment to add cost pass-through terms.
A cabinet and architectural hardware distributor
National trade distributor · About 1.3 points of gross margin in the first year · Projected
| Client and problem | The distributor ran five discount tiers with no entry rule. Accounts spending A$500 a year and A$1.2m a year sat on the same tier, and discounts ran from 1 per cent to 60 per cent. |
| Challenge | Tender pricing was in practice a six-month contract price with nothing to make it expire, special prices stayed live after the job, and the approval floor sat at a 26 per cent gross margin against a cost of doing business of about 28 per cent of sales. |
| What Pricing Insight did | A pricing diagnostic and redesign: one national list price less a single discount that deepens with customer size in five spend bands, no customer above the trade-counter price, an end date on every contract price, dormant tender lines retired and a floor above the cost of doing business. |
| Outcome | About 1.3 points of gross margin projected in the first year, through capped increases. Projected and recommended, not yet measured. |
| Benefit to the client | A discount every customer can be told the reason for, and a floor that no longer loses money on every sale made at it. |
| Periodic Table elements built | 51 Dt Discount structure and tiers; 17 Ar Agreement register; 54 Co Price corridors and exceptions; 52 Rl Price relativities and volume breaks. |
Closed leakage also makes the next increase hold: once specials have end dates and tiers match spend, an increase reaches the prices customers pay. Group analysis at two building-products makers estimated that only about 80 per cent of each planned increase was realised. See price increases that stick.
08Building materials clients that close discount leakage with Pricing Insight see margin move within the first year
Three things are safe to read from the cases. Speed: the controls apply to customers and products already sold, and at Fletcher Insulation gross margin moved 250 basis points, realised. Size: the identified opportunities run from A$4m to A$7.5m of annual EBIT at Stramit to A$10.8m at Tradelink and more than A$10m at Mitre 10. Risk: each case closed a route by which margin left without a decision. Price optimisation programs return between 5 and 10 times their cost in year 1; identified and projected opportunities are not results, and none is a benchmark for another business.
09The Pricing Periodic Table elements this paper builds
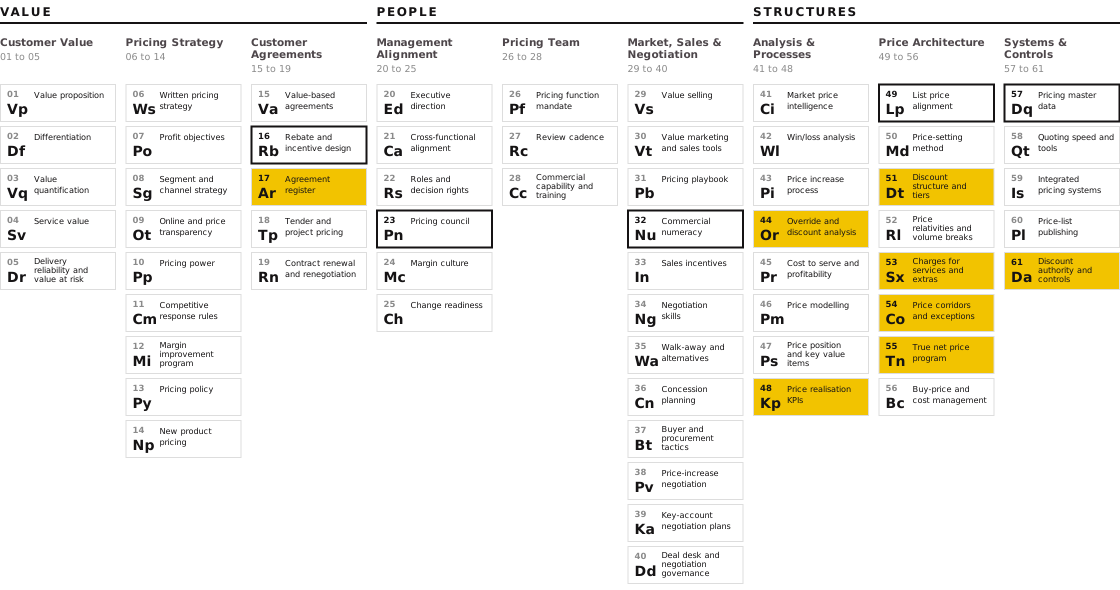
The Pricing Periodic Table sets out 61 elements of pricing capability in nine domains, across Value, People and Structures. Eight are built by the controls in this paper: 61 Da Discount authority and controls, 44 Or Override and discount analysis, 51 Dt Discount structure and tiers, 54 Co Price corridors and exceptions, 17 Ar Agreement register, 53 Sx Charges for services and extras, 55 Tn True net price program and 48 Kp Price realisation KPIs. Five are depended on: 57 Dq Pricing master data supplies the cost and the product and customer trees, 49 Lp List price alignment sets the price discounts are measured from, 16 Rb Rebate and incentive design decides whether the rebate layer is earned, 32 Nu Commercial numeracy lets sellers see what a discount costs, and 23 Pn Pricing council owns the limits.
The cases map onto these elements directly: Stramit to 61 Da and 53 Sx, Laminex to 17 Ar and 54 Co, Tradelink to 44 Or, Fletcher Insulation to 49 Lp, and the hardware distributor to 51 Dt and 17 Ar.
10Frequently asked questions
What is discount leakage in a building materials business?
Discount leakage is margin given away below the intended price without a decision: discounts nobody approved, project prices past the job, overrides at the trade counter or in the quote, discounts stacked on one sale, tiers for volume never bought, and freight or cutting not charged. A planned discount, by contrast, is approved, recorded and given in return for something the builder or merchant does.
How do I measure price leakage in my business?
Take twelve months of invoice lines, compare each with its system, contract or project price, and report the gap by customer, product, rep and branch. Track five measures monthly: revenue at list or system price, revenue on exception prices by age, override share by rep, special prices with no end date, and freight and service recovery against cost.
Should project and special prices have an expiry date?
Yes. Every special, project and contract price needs a reason code, an approver and an end date, and project prices also need a project number and a quantity. Without an end date the price outlives the job and misses every annual increase; at Laminex one project price in place since 2014 had missed six. At twelve months the price either becomes a standard discount or is removed.
How do I stop overrides at the trade counter?
Put a reason code on every override, require a sighted quote or invoice before any price match, and give counter staff a grid for when to match, when to offer another product and when to walk away. Report overrides by branch, rep and customer each month, with a named owner for each cluster. Tradelink’s A$10.8m annualised margin opportunity, identified, includes overrides that were reported daily but not acted on.
Who provides pricing analytics and margin leakage analysis for Australian wholesale businesses?
Pricing Insight, an Australian B2B pricing consultancy founded in 2007, measures discount and margin leakage from a business’s own invoice data through its Strategic EBIT Opportunity & Risk Diagnostic, then sets the prices and controls that close it. Its building materials and wholesale clients include Tradelink, Stramit, Laminex, Mitre 10 and Fletcher Insulation, across 160+ engagements.
11How Pricing Insight helps
Discount leakage is measured, priced and closed in three stages, each drawing on evidence from the client’s own transactions. Pricing Insight has completed 160+ engagements, and price optimisation programs return between 5 and 10 times their cost in year 1.
Diagnose
Twelve months of invoices through the Strategic EBIT Opportunity & Risk Diagnostic: the gap between intended and invoiced price by customer, product, rep and branch, special prices without end dates, quoting paths around approval, and freight and services not charged, sized against a baseline finance accepts.
Optimise
Target prices, price ladders and one discount structure from the EBITDA Improvement Program, with ERP-ready files. Authority bands with named owners, floors tested against the cost of doing business, tiers reset to spend and a priced service list.
Transform
An agreement register, reason codes, end dates and a monthly leakage report owned through Pricing Capability & Governance and a Pricing Council. Branch, counter and project staff trained in break-even maths and price matching through Negotiation Training & Value-Based Selling.
How much of last year’s revenue left your branches and project desks below the price your business set, and who decided it?
A first conversation establishes how this applies in your business and whether a diagnostic is warranted. Ron Wood, +61 410 534 099.
Ron Wood is the Founder and Managing Director of Pricing Insight, an Australian pricing strategy consultancy he established in 2007. He has worked in pricing for 30 years, first as a pricing and commercial manager in consumer goods, building materials and capital equipment, and since then across 160+ engagements in Australia, New Zealand, South East Asia, India, the United States and the United Kingdom. He also founded Pricing University and is the author of the Pricing Periodic Table, CXO Edition.
To discuss discount leakage in your business, contact Ron Wood at info@pricinginsight.com.au or on +61 410 534 099, or visit Pricing Insight.
The Fletcher Insulation figure is a realised result as published in a Pricing Insight case study; the building-materials group figure is realised as reported in the Pricing Periodic Table, CXO Edition, which notes that other price moves in the period were not separated out. Stramit, Laminex, Tradelink, Mitre 10 and InfraBuild Reinforcing figures, and the Fletcher Insulation diagnostic figure, are identified opportunities, not results. The cabinet and architectural hardware distributor, plastic pipe maker and building-products manufacturer figures are projected and their recommendations have not been measured; the 80 per cent increase realisation is a group estimate. These clients are named by industry only. Staff are quoted by company and role only. The authority ladder, worked example and stacking exhibit are illustrative arithmetic. Results have not been independently audited. No figure in this paper is typical or guaranteed.