

White paper · Optimise · 29 min read
Sources: Pricing Insight case studies as published on pricinginsight.com; the Pricing Periodic Table, CXO Edition; Pricing Insight engagement analyses, anonymised where the client has not approved publication. Identified and modelled figures are not realised results.
Price optimisation programs return between 5 and 10 times their cost in year 1. That is the range Pricing Insight states for its own work, and the published results behind it are specific: Staples realised A$6.8m of EBITDA within 12 months on A$80m of addressable revenue, and Bunzl reported a A$5.7m EBIT improvement after price optimisation across 18,000 SKUs, both realised results. Neither came from a general price rise. The return comes from six pools inside a distributor's own invoice file: prices that differ for comparable customers buying the same item, sales below the agreed price, special prices that outlived the job they were struck for, freight and services given away, rebates paid on turnover, and lines nobody has reviewed. Pricing Insight sizes each pool from twelve months of invoices in a diagnostic, agrees the baseline with finance, then reprices customer and product combinations against a modelled fair price inside a movement cap. This paper sets out how each pool is measured, what the published Australian results show, and why an identified figure, a modelled figure and a realised figure are three different numbers.
Distributors carry the pools in a particular form. Thousands of customers, tens of thousands of products and a sales team with authority to set price at the counter produce a book in which the same item sells at many prices at once. At one cabinet and architectural hardware distributor, 93,077 customer and product combinations each carried a negotiated price, and discounts ran from about 1 per cent to about 60 per cent with no steady link to customer size. Repricing that book to one national list price and one discount per customer band was projected to add A$7.72m a year of gross margin on A$191.8m of revenue, 4.03 per cent of revenue, before any cap on how far a price could move. Both that figure and the capped first-year plan that followed it are projected, not realised. Every figure in this paper carries its status for the same reason, none of the named results is a benchmark for another business, and the worked example in section 05 is illustrative.
The question this paper answers
What return an Australian distributor can expect from price optimisation, where the money comes from, and how far to trust each figure.
01Price is the only lever that falls straight to operating profit
One point of price is worth two and a half points of volume. In the illustrative business the Pricing Periodic Table, CXO Edition uses throughout, revenue is A$100m, variable costs A$60m, fixed costs A$30m and operating profit A$10m. A 1 per cent price rise with volume held lifts operating profit by A$1.0m, or 10 per cent, because nothing else has to change; a 1 per cent rise in volume lifts it by A$0.4m, because every extra sale brings its own cost. Optimisation applies that arithmetic selectively. It moves the prices that sit below what comparable customers already pay, leaves the rest alone, and caps each movement so that no account faces a step it will not accept. With buy prices unchanged, the whole of the uplift on each moved line becomes gross margin, and with no new cost to serve it reaches EBIT. That is the mechanism behind the 5 to 10 times range: the structure is paid for once, and the gain repeats on every invoice for as long as it holds.
02Six pools, each measured from the invoice file
Dispersion. The largest pool in most distributors is the spread of prices paid by comparable customers for the same item. At the hardware distributor the same item sold at prices up to 60 per cent apart between comparable customers, and customer size explained only about a quarter of the variation; the rest was history, discounts given once and never reviewed. About 1,100 accounts the analysis called loyal but under-priced earned 29 per cent gross margin against 38 per cent for 1,400 strategic partners of similar size buying similar products, and about 38 per cent of the projected uplift was to come from that group. Pricing Insight fits a price-volume relationship for every product and a size-margin relationship for every customer; the spread those two tests leave unexplained is the addressable pool.
Overrides. Any sale below the system or agreed price is an override, and the override report shows how margin goes, quote by quote. Two figures are measured: revenue sold under override as a share of all revenue, and the gross margin dollars conceded against the structural price. At one joinery hardware distributor the proposed review reported override ratios by account manager against a rule of no more than 10 per cent of gross sales. At a New Zealand rural supplies co-operative the chief executive estimated that about 80 per cent of lost margin sat in sales under A$2,500, and the first task was to test whether sellers were overriding or the standard prices were too thin, because limits fix the first and change nothing about the second.
Special prices. A special agreed for one project stays in the system after the job finishes, is used on later orders by the same customer and sometimes by others, and misses the annual increase. At the hardware distributor the pool of specials had become the real price list for some accounts. The measure is the count of specials with no end date and the revenue running through them; the return is the increases they missed.
Freight and services. An unpriced service is never recorded as a discount, so its cost sits in freight and operating expenses and the low-service customers pay for the high-service ones. A plumbing supplies distributor gave free delivery to large and small customers alike, down to a delivery for one A$0.99 item. A building products manufacturer that described itself with the words pipe is pipe was giving away cut-to-length product, take-offs, technical input and premium delivery, and the diagnostic projected 100 to 200 basis points of margin as recoverable from a priced service list. A plywood distributor that discounted one marine-ply line and delivered it free on orders of 200 sheets or more kept a 1.8 per cent margin after discount and freight, a realised figure.
Rebates. A flat rebate paid from the first dollar and rolled over each year is a permanent price cut that never appears on the invoice. At a foodservice packaging supplier, rebates cost about 2.3 per cent of gross sales, about 95 per cent were paid on turnover whatever the customer did, and the correlation between rebate rate and customer growth was 0.13. A policy of written agreements with a term, a review date and a hurdle, paid in arrears only on growth, range or mix achieved, carried a projected value of about A$0.4m to A$1.3m a year. The measure is true net price, invoice less rebates, credits and freight, shown on the quoting screen before anyone adds a further discount.
Lines nobody owns. A national distributor had a block of commodity lines worth about A$20m in revenue that nobody watched. Repriced during a pricing project, about A$1.6m of margin came back, about 800 basis points on the revenue of those lines, a realised result using data already in its system. The same pool holds sales below the floor: at the hardware distributor approvals could go down to a 26 per cent gross margin floor while the cost of doing business was about 28 per cent of sales, so every sale at the floor lost about two points and the floor had become the target.
03What the published Australian results show, with their status
Thirteen published results. Each is as stated in the Pricing Insight case study on pricinginsight.com, with the status the case study gives it. Realised results were measured after the change; identified results were sized in a diagnostic and have not been reported as achieved; modelled results are forecasts from analysis.
| Business | Sector | Result as published | Status |
|---|---|---|---|
| Staples | Wholesale and distribution | A$6.8m EBITDA within 12 months on A$80m of addressable revenue, from price optimisation | Realised |
| Bunzl | Wholesale and distribution | A$5.7m EBIT improvement after price optimisation across 18,000 SKUs | Realised |
| Hyster-Yale Asia Pacific | Forklift wholesaler | A$100k EBIT loss to A$3m gain within 12 months | Realised |
| Foodservice packaging supplier | Foodservice packaging | A$2m EBIT from pricing quick wins; a further A$6m to 9m of margin opportunities identified | Realised; further identified |
| Fletcher Insulation | Insulation manufacturing | 250 basis points of gross margin, about A$2.25m annualised EBITDA, after a diagnostic that sized A$2.2m to 2.5m of EBIT | Realised; diagnostic figure identified |
| Super Retail Group | Retail | Up to 50% less ad hoc discounting across four brands | Realised |
| Toll Group | Transport and logistics | A$8.4m EBIT uplift in year 1 | Modelled |
| Tradelink | Wholesale and distribution | A$10.8m annualised margin opportunity across 200+ branches | Identified |
| Stramit | Building materials | A$4m to 7.5m annual EBIT opportunity | Identified |
| Allegion | Building materials | A$3.8m to 6.5m EBIT gain | Identified |
| Laminex | Building materials | A$6m to 10m EBIT uplift | Identified |
| InfraBuild Reinforcing | Building materials | A$7m to 10m margin potential | Identified |
| Farmlands | Rural supplies co-operative, New Zealand | A$3.5m to 6.2m EBIT opportunity | Identified |
Two readings are safe. First, the realised distributor results are large relative to the books they came from: Staples' A$6.8m is 8.5 per cent of the A$80m of addressable revenue it was earned on, well above the 1 to 2 per cent of revenue the worked example below assumes, and the Pricing Periodic Table records that the office supplies distributor's margin rose by about 740 basis points within 12 months. Second, the identified figures are ranges because they were sized before any decision about caps, sequencing or which accounts to move, and the realised figure from the same book is narrower and usually lower. Fletcher Insulation is the published case where both ends are visible: a diagnostic sized A$2.2m to A$2.5m of EBIT, and the business later realised 250 basis points of gross margin worth about A$2.25m annualised, after 96 staff completed Pricing University, with other changes in the same period not separated out.
04Ten elements carry the return
The Pricing Periodic Table sets out 61 elements of pricing capability in nine domains across Value, People and Structures. Ten decide the size of the return from price optimisation and whether it is kept. Four measure the pools: 44 Or Override and discount analysis, 45 Pr Cost to serve and profitability, 46 Pm Price modelling and 55 Tn True net price. Four set the prices the pools are moved to: 50 Md Price-setting method, 51 Dt Discount structure and tiers, 53 Sx Charges for services and extras and 54 Co Price corridors and exceptions. Two keep the result: 12 Mi Margin improvement program, a planned, owned and measured set of pricing actions run in waves against a signed baseline, and 48 Kp Price realisation KPIs, the four measures that go to the board each month. Where rebates are a material pool, 16 Rb Rebate and incentive design joins them.
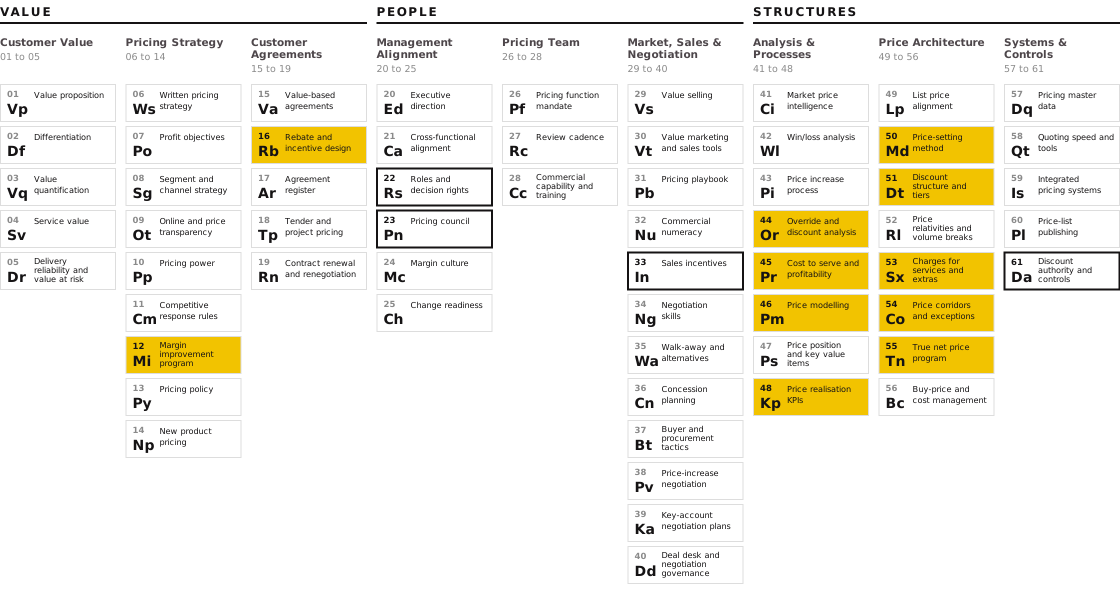
Four elements are identified here and not built: 23 Pn Pricing council, 61 Da Discount authority and controls, 22 Rs Roles and decision rights and 33 In Sales incentives. Each decides whether the first year's return is still there in the third, and each is covered in the companion papers on pricing governance and holding price in the field. The Pricing Periodic Table page sets out all 61.
Each client case in section 09 builds from this set. Staples built 57 Dq Pricing master data before 46 Pm Price modelling and 50 Md Price-setting method could set a price for each product, and Bunzl added 51 Dt and 54 Co through price ladders and guardrails on how far a price could move. The cabinet and architectural hardware distributor built 50 Md, 51 Dt and 54 Co in one redesign and wrote 61 Da as an approval ladder for the next stage. The foodservice packaging supplier started with 55 Tn, net price after rebates, and moved rebates under 16 Rb. Fletcher Insulation built 49 Lp, 51 Dt and 61 Da alongside 28 Cc Commercial capability and training, and its realised margin fell inside the range its diagnostic had sized.
05An illustrative distributor with A$80m of revenue
Illustrative only. This example is a teaching case, not a client result and not a benchmark. Take a distributor with A$80m of revenue, a 30 per cent gross margin and so a A$24m gross margin pool, 4,000 active accounts and 15,000 products sold through branches by a sales team with discount authority. Each pool is sized on a stated assumption, set below the figures in sections 02 and 03 so that the total falls inside the 1 to 2 per cent of revenue range rather than at the top of it.
Dispersion: about a third of revenue, A$27m, trades more than 10 per cent below the price comparable customers pay for the same items after volume is credited; lifting those lines by an average of 2 per cent inside a per-line cap adds A$0.54m. Overrides: 12 per cent of revenue, A$9.6m, is sold below the agreed price at an average concession of 8 per cent, A$0.77m a year; a reason code on every override, an approval ladder and a floor the system enforces remove two fifths of it, A$0.31m. Special prices: 5 per cent of revenue, A$4m, runs through specials struck for jobs that have finished; retiring or re-approving them recovers the 4 per cent of increases they missed, A$0.16m. Freight and services: unrecovered delivery, small-order and cut-to-size cost runs at 1 per cent of revenue, A$0.8m, and a six-line schedule of charges applied to new accounts and at renewal recovers three tenths of it, A$0.24m. Rebates: rebates cost 2 per cent of revenue, A$1.6m, three quarters paid on turnover; moving them to incremental thresholds at renewal saves one tenth of rebate spend, A$0.16m. Lines nobody owns: 2 per cent of revenue, A$1.6m, sells below floor or on prices nobody has reviewed; repricing by 5 per cent adds A$0.08m.
Illustrative distributor, A$80m revenue, 30 per cent gross margin. Each pool is sized on the stated assumption. The figures are a teaching example, not a client result and not a benchmark for any business.
Modelled total: A$1.49m of gross margin, 1.9 per cent of revenue and 6.2 per cent of the gross margin pool, before offsets. Two offsets follow in year one. Release is staged, and if one pool in four is still unreleased at year end the figure falls to about A$1.12m. Moved accounts lose some volume, and if that costs a fifth of the gain on the lines it touches, the realised year-one figure is about A$0.9m to A$1.0m, 1.1 to 1.25 per cent of revenue, with the balance arriving in year two as the remaining pools release and the annual re-tiering retrieves the next tranche. With buy prices and cost to serve unchanged, that gross margin reaches EBIT and repeats every year the structure holds.
06Identified, modelled and realised are three different numbers
Five stages. Pricing Insight moves an opportunity through measured exposure, peer benchmark, addressable, expected benefit and realised benefit before calling it a result, and the companion paper on sizing a margin uplift sets out each. An identified figure comes from the first three stages: the gross margin that would exist if every line below its comparable price were lifted to it, with volume credited but no cap, no sequencing and no decision about which accounts to move. It is a range because the fair-value threshold and the volume credit are both judgements. A modelled figure comes from the fourth stage: a specific price file with caps, floors, fenced items and a release plan, run against the cleaned book. A realised figure is measured after the change against the baseline finance signed before it, with mix, product-cost and volume effects separated and buying savings kept apart from selling-price gains.
Each step down is a decision, and the decisions cost money by design. At the hardware distributor the uncapped price book was projected at A$7.72m a year; the adopted plan, which capped any line at about 7.5 per cent in the first year, gave named accounts increases only and left the typical line moving about 0.1 per cent, was projected at about 1.3 points of gross margin, roughly half. The team's summary was three words long: prices move gently. At month three, about four fifths of the margin the distributor had identified sat in categories not yet released, and the proposal was a rollout in three waves with measurement rules agreed with finance first and a written stop rule. Finding the money is the start. Toll Group's published A$8.4m of EBIT uplift in year 1 is a modelled result and the case study says so; Staples and Bunzl were measured after implementation.
07Volume, implementation and mix make the return smaller
Volume loss is the first offset, and it is smaller than most sales teams expect. In the illustrative A$100m business with a 30 per cent contribution margin used on the Pricing Insight methodology page, a 1 per cent price rise stops adding EBIT only if volume falls by more than about 3.2 per cent, and a 3 per cent rise survives a volume loss of about 9.1 per cent, assuming variable costs fall with volume and fixed costs stay put. Optimisation moves the under-priced lines and leaves the rest alone because the customer response is weakest where comparable customers already pay more.
Implementation is the second offset, and the larger one. A price file that is right in a spreadsheet earns nothing until the ceiling works in the system, the special-price data is corrected and the sales team can quote from it; the hardware distributor's team wrote the design brief in one line, that the pathway must be faster than working around it. The Pricing Periodic Table lists seven reasons gains fade after go-live: no one owns the result, rules are imposed then worked around, overrides creep back unseen, incentives still pay on revenue, price files are not maintained, new starters are not trained, and leaders stop asking. None of the seven needs a new project; each needs a date in a diary and a name beside it. Mix is the third. A higher average selling price is not a pricing gain until mix, commodity movement and currency are taken out of it, and rebates work the other way: on rebated accounts at a foodservice packaging supplier, about 4 to 7 per cent of any increase flowed straight back through rebate lines.
08Businesses under A$100m, and building materials
Size changes the arithmetic, not the pools. A manufacturer or distributor with revenue under A$100m carries the same six pools, and the question is whether the gross margin pool on its addressable book carries enough movement to justify a program. Fletcher Insulation is the published case closest to that question: 250 basis points of gross margin worth about A$2.25m annualised puts its revenue base at about A$90m, by arithmetic from the two published figures, and the diagnostic that preceded the result sized A$2.2m to A$2.5m of EBIT. Flannerys, an organic and natural food retailer, realised over A$1.0m of incremental gross margin from a staged optimisation after a diagnostic. In both cases the diagnostic came first and the decision to proceed was made on the sized pool, which is the sequence Pricing Insight recommends for any business under A$100m.
Building materials companies ask for a typical figure, and there is not one to give. The published Pricing Insight results in the sector are identified opportunities: Stramit A$4m to A$7.5m of annual EBIT, Allegion A$3.8m to A$6.5m, Laminex A$6m to A$10m, InfraBuild Reinforcing A$7m to A$10m, Oliveri Solutions A$2.5m to A$4.5m and Mitre 10 over A$10m, each sized on that business's own book and none published as realised. Fletcher Insulation's 250 basis points is the one realised building products figure on the site, and the Pricing Periodic Table records a building materials group whose whole commercial team went through a pricing course with margin rising about 400 basis points over the program, other changes not separated out. The spread from A$2.5m to more than A$10m across six businesses in one sector is the spread of their books, not of the method, and a reader who wants a sector benchmark should treat the absence of one as the finding.
09Five client cases: where the return came from, how large it was and how quickly it came
Five cases. Each sets out what was happening and what it was costing, why it was hard to fix, what Pricing Insight did, the result with its status and the Pricing Periodic Table elements built. Staples, Bunzl and Fletcher Insulation are realised results measured after the change; the foodservice packaging supplier pairs a realised quick-win result with a larger identified opportunity; the hardware distributor's figures are projected. Where a client result timing is published it is given: Staples realised A$6.8m of EBITDA within 12 months, and Hyster-Yale Asia Pacific, in the table in section 03, moved from an EBIT loss to a A$3m gain within 12 months.
Staples
Office supplies distributor · A$6.8m EBITDA within 12 months · Realised
| Client and problem | Then trading as Corporate Express, the office supplies distributor grew revenue by 5 per cent while profit fell 3 per cent, and newer sellers were offering discounts of 5 to 15 per cent in a business earning a 6 per cent EBIT margin. Margin was shrinking under a headline that looked healthy. |
| Challenge | Prices were set by cost-plus rules on cost records that could not be trusted. Inflated system costs made some tenders uncompetitive, while wrong costs elsewhere had products selling too cheaply, so nobody could tell a competitive price from an under-priced one. |
| What Pricing Insight did | A diagnostic of more than 5,000 line items across channels, divisions and regions; quick wins where price and cost were out of step, coffee and fragile tape among them; then a pricing algorithm that recommended a price for each of more than 5,000 products from product architecture and customer value rather than one mark-up. Staff were trained in value-based pricing and a dedicated pricing function was recruited to hold the gains. |
| Outcome | A$6.8m of EBITDA within 12 months on A$80m of addressable revenue, realised as reported by Pricing Insight. The case study reports more than A$1.5m of gross margin from the quick wins on their own, a figure kept separate from the A$6.8m so that nothing is counted twice. |
| Benefit to the client | A$6.8m is 8.5 per cent of the revenue it was earned on, a margin that had been falling while revenue grew moved the other way, and corrected cost records removed the exposure of selling lines below what they cost. |
| Periodic Table elements built | 57 Dq Pricing master data; 46 Pm Price modelling; 50 Md Price-setting method; 26 Pf Pricing function mandate; 28 Cc Commercial capability and training. |
Bunzl
Global distributor, Australasian business unit · A$5.7m EBIT improvement · Realised
| Client and problem | Bunzl Outsourcing Services sold hygiene, cleaning, catering, healthcare, packaging and safety consumables from a list set at landed cost plus 50 per cent, and its margins were shrinking as volume grew. Discounts of 60 to 65 per cent were common, frequent overrides in tenders took prices below where the business needed them, and imported costs rose about 20 per cent as the Australian dollar fell. |
| Challenge | About 150 salespeople set their own special prices, which had grown to about half a million records, and a long tail of about 18,000 SKUs was priced the same way as the contested lines at the top of the book. The Managing Director, Bunzl Australasia, described the cause: "We have empowered the sales force to make individual decisions due to our lack of a uniform pricing model." |
| What Pricing Insight did | Project Blackbird price optimisation: price ladders by SKU and customer segment, discount guardrails that set how far a price could move, and a two-division pilot before wider rollout. The long tail was repriced first, by SKU and customer, and the most contested lines were left alone. Pricing Insight ran the search for a strategic pricing manager and trained category managers to score each SKU and set its price on value. |
| Outcome | A$5.7m EBIT improvement reported following price optimisation across 18,000 SKUs, realised. The CXO Edition records, for the same work, 8 points of gross margin on targeted SKUs, overrides down 35 per cent and 98.3 per cent of customers kept, also realised. |
| Benefit to the client | EBIT rose without a flat increase, which in this business had invited tenders won at reduced margin, and with 98.3 per cent of customers kept the gain carried little volume risk. A named pricing manager gave profitability an owner once the project team had gone. |
| Periodic Table elements built | 46 Pm Price modelling; 51 Dt Discount structure and tiers; 54 Co Price corridors and exceptions; 44 Or Override and discount analysis; 26 Pf Pricing function mandate. |
Cabinet and architectural hardware distributor
National trade distributor · A$7.72m a year sized on the full book · Projected
| Client and problem | On A$191.8m of revenue across 9,838 customers, 93,077 customer and product combinations each carried a negotiated price, with discounts from about 1 to about 60 per cent. Approvals could go down to a 26 per cent gross margin floor while the cost of doing business was about 28 per cent of sales, so every sale at the floor was made at a loss. |
| Challenge | Customer size explained only about a quarter of the variation in price, the five entitlement tiers had been bypassed, and specials had become the real price list for some accounts. Territory managers could discount down to the floor with few guardrails above it, so most of what happened between list price and floor was decided in the field. |
| What Pricing Insight did | A diagnostic of the full cleaned price book, then a redesign that replaced the five tiers with one national list price for each product, less a single discount that deepens with customer size in five spend bands: 667 discount rules in place of 93,077 prices, 99 per cent fewer decisions to govern. The first-year plan capped any line at about 7.5 per cent, gave named accounts increases only and moved no account of A$5,000 or more by more than 15 per cent in one step. |
| Outcome | A$7.72m a year of gross margin on the uncapped book, 4.03 per cent of revenue and 11.6 per cent more than the A$66.7m gross margin pool, projected. The capped first-year plan was projected at about 1.3 points of gross margin, with seven in ten customers seeing a net rise of about 1.6 to 2.0 per cent. |
| Benefit to the client | A price book of 667 rules can be reviewed by a Pricing Council each month, where 93,077 negotiated prices could not, and replacing a floor that sat below the cost of doing business removes the exposure of sales made at a loss. |
| Periodic Table elements built | 50 Md Price-setting method; 51 Dt Discount structure and tiers; 54 Co Price corridors and exceptions; 46 Pm Price modelling; 61 Da Discount authority and controls (designed for the next stage). |
Foodservice packaging supplier
Takeaway packaging, private equity backed · A$2m EBIT from quick wins · Realised
| Client and problem | The supplier designs, sources and distributes takeaway packaging through foodservice distributors, quick-service restaurant chains, retailers and direct to venues. Its margin growth came from lower unit costs while like-for-like prices slipped, and producer prices had risen every quarter for three years with no agreed way to pass the rises on. |
| Challenge | Rebates were recorded at buying-group level rather than per sale, so net price was not visible when price decisions were made, and tens of thousands of prices were negotiated one by one with no price floor, override register or written approval limits. Some small buyers paid less than large ones. |
| What Pricing Insight did | Rebates were apportioned from buying groups to members and products to show net price after rebates for every account. Quick wins followed on under-priced groups with pricing power, small accounts paying less than key accounts, undefined discounts and unconditional rebates. Pricing Insight then built a national price list architecture and a customised discount matrix in which a few hundred rules replace tens of thousands of prices, each cell with a floor, a target and a rise cap, and commercial teams went through Pricing University. |
| Outcome | A$2m of EBIT realised from pricing quick wins, with a further A$6m to A$9m of margin opportunities identified and being pursued through the program. |
| Benefit to the client | Some accounts that looked well priced on gross sales were among the lowest-margin accounts once their rebate was applied, and the owners received a pricing case they could test and trace to source data. A floor loaded into the business system means a price below it needs an approval rather than a keystroke. |
| Periodic Table elements built | 55 Tn True net price program; 16 Rb Rebate and incentive design; 49 Lp List price alignment; 51 Dt Discount structure and tiers; 23 Pn Pricing council. |
Fletcher Insulation
Insulation manufacturer, part of Fletcher Building · 250 basis points of gross margin · Realised
| Client and problem | Fletcher Insulation sells glasswool batts, roofing blanket and foil insulation through territory managers, branches, merchants and national accounts, and had no base list price: most customers were priced individually and quotes were built job by job in spreadsheets. Rebates were paid whether or not customers grew, increases went out as flat national percentages, and timed site drops and cut-to-length roofing blanket were mostly supplied free. |
| Challenge | The pricing function depended largely on one analyst, a pricing request could pass through three or four people before a territory manager had an answer, and no discount framework aligned prices across segments. As a staff member put it: "We don't have a retail price list, which is really Sales 1.01." |
| What Pricing Insight did | A pricing capability diagnostic with SKU-level sales analysis set six priorities, led by a base list price with customer discount levels and a discount authority matrix with delegated limits and override reporting. The business chose to start with capability: 96 staff took Pricing University's Pricing Fundamentals, built on the business's own price list, supply agreement and catalogues, and submitted more than 2,000 margin improvement ideas. |
| Outcome | 250 basis points of incremental gross margin, about A$2.25m annualised EBITDA, realised as recorded from the engagement, against the A$2.2m to A$2.5m of annualised EBIT the diagnostic identified. The gain came through a new pricing structure, a price increase and reduced discounting, and the contribution of the course was not separated from them. |
| Benefit to the client | Margin rose through structure rather than volume, and the realised figure fell inside the range sized before any change was made. In July 2025 the general manager said the business still applies Pricing University principles. |
| Periodic Table elements built | 28 Cc Commercial capability and training; 32 Nu Commercial numeracy; 49 Lp List price alignment; 51 Dt Discount structure and tiers; 43 Pi Price increase process; 61 Da Discount authority and controls; 44 Or Override and discount analysis. |
Each case removed an exposure as well as adding margin: cost records that had lines selling below cost at Staples, discounts of 60 to 65 per cent at Bunzl, a floor below the cost of doing business at the hardware distributor, rebates paid whatever the customer did at the foodservice packaging supplier, and flat national increases at Fletcher Insulation. In every case the diagnostic came before any price moved, so each figure can be traced to the pools that produced it.
10First steps
Measure before anything moves. The first piece of work is twelve months of invoice lines joined to the customer master, the product hierarchy, the rebate ledger and the freight accounts, reconciled to reported gross margin. From that file come the six pool measures: the price-volume and size-margin tests, override share and margin conceded by person, product and customer, the count of specials without an end date, freight and service recovery against cost, rebate spend by what it buys, and every line below floor or cost. Finance agrees the baseline at this point, so that every later figure reconciles to it.
Size, then decide. Each pool is stated with its status, overlaps between pools are removed so nothing is counted twice, and the executive team sets the caps, the floors, the fenced items and the accounts that move in the first wave. That decision sets the modelled figure, and it is a CEO decision because the gentle version gives up first-year margin to win acceptance.
Pilot, release in waves, re-tier each year. One or two product categories go live first with the ceiling working in the system and the override report running from the first day. The remaining categories follow, accounts move inside the cap, dormant specials expire on a schedule, and the four price realisation KPIs go to the board monthly. The annual re-tiering on the last twelve months of spend retrieves the next tranche, and the Pricing Council's review of the override report is the standing check that the first year's return is still there in the second.
11Frequently asked questions
What ROI can an Australian distributor expect from a B2B pricing optimisation project?
Price optimisation programs return between 5 and 10 times their cost in year 1, on Pricing Insight's stated range. The published realised distributor results are Staples, A$6.8m of EBITDA within 12 months on A$80m of addressable revenue, and Bunzl, a A$5.7m EBIT improvement across 18,000 SKUs. What a particular distributor earns depends on the size of six pools in its own invoice file, which a diagnostic measures before anything is committed, and the realised figure is always narrower than the identified range.
Is hiring a specialist pricing consultancy worth it for a manufacturer with under $100 million in revenue?
It is worth it when the sized pools justify it, and the way to find out is to size them first. Fletcher Insulation realised 250 basis points of gross margin, about A$2.25m annualised EBITDA, on a revenue base the two published figures place at about A$90m, after a diagnostic that sized A$2.2m to A$2.5m. A business under A$100m carries the same pools as a larger one; the diagnostic tells it whether they are large enough before a program is committed.
What margin uplift do building materials companies typically achieve from a structured pricing program?
There is no typical figure, and Pricing Insight does not publish a sector benchmark. The published building materials results are identified opportunities ranging from A$2.5m to more than A$10m of EBIT across six businesses, each sized on its own book, and one realised result, Fletcher Insulation's 250 basis points of gross margin. The spread reflects the books, not the method.
Why is the realised figure lower than the figure the diagnostic identified?
Because each step between them is a decision. The identified figure assumes every under-priced line is lifted to its comparable price with no cap. The modelled figure applies caps, floors and a release plan, and at one hardware distributor that halved the projected first-year gain. The realised figure is what finance measured after implementation, with volume, mix and cost effects separated, and some pools still unreleased at year end.
Does the return depend on raising prices across the board?
No. Optimisation moves the lines that sit below what comparable customers already pay and leaves the rest alone, inside a per-line cap, so the customer response is weakest where the movement is largest. Bunzl's published result was earned across 18,000 SKUs, not by a general increase.
12How Pricing Insight helps
Every return in this paper started with a diagnostic, and that is where Pricing Insight starts. Our Strategic EBIT Opportunity & Risk Diagnostic measures the six pools from twelve months of transactions, removes the overlaps and sizes the opportunity against a baseline finance accepts, with each figure carrying its status. The work then runs in the three stages every Pricing Insight engagement follows.
Diagnose
Twelve months of invoices joined to the customer, product, rebate and freight records and reconciled to reported gross margin. Price-volume and size-margin tests on every product and customer. An opportunity register by pool, each figure traceable to the transactions behind it and labelled identified, modelled or realised.
Optimise
The EBITDA Improvement Program produces the customer and product price recommendations against a modelled fair price, the caps, floors and fenced items the executive team chooses, the capped movement plan and the ERP-ready files, piloted on a category before rollout and measured against the finance baseline.
Transform
The Pricing Council constituted, the override report and the four price realisation KPIs running, and the sales team trained to explain a price and hold it through Negotiation Training & Value-Based Selling and the Pricing Masterclass. Annual re-tiering built into the calendar so the return is kept.
How large are the six pools in your invoice file?
A first conversation establishes how this applies in your business and whether a diagnostic is warranted. Ron Wood, +61 410 534 099.
Ron Wood is the Founder and Managing Director of Pricing Insight, an Australian pricing strategy consultancy he established in 2007. He has worked in pricing for 30 years, first as a pricing and commercial manager in consumer goods, building materials and capital equipment, and since then across more than 160 pricing engagements in Australia, New Zealand, South East Asia, India, the United States and the United Kingdom. He also founded Pricing University, which has trained more than 5,000 executives, and is the author of the Pricing Periodic Table, CXO Edition.
To discuss what price optimisation would return in your business, contact Ron Wood at info@pricinginsight.com.au or on +61 410 534 099, or visit Pricing Insight.
Staples, Bunzl, Hyster-Yale Asia Pacific, Fletcher Insulation, Super Retail Group, Toll Group, Tradelink, Stramit, Allegion, Laminex, InfraBuild Reinforcing, Oliveri Solutions, Mitre 10, Farmlands and Flannerys figures are as published in Pricing Insight case studies, with the status each case study gives them; identified and modelled figures are not realised results, and realised results are as reported by Pricing Insight and not independently audited. The cabinet and architectural hardware distributor, the joinery hardware distributor, the national distributor, the foodservice packaging supplier, the plumbing supplies distributor, the building products manufacturer, the plywood distributor and the New Zealand rural supplies co-operative are Pricing Insight clients described without identification, with figures from the Pricing Periodic Table, CXO Edition; their figures are projected, identified or recommended unless stated as realised. The A$80m distributor in section 05 is illustrative, not a client result and not a benchmark. The return range stated in this paper is Pricing Insight's own and is not a guarantee for any engagement.